The Da Vinci Indicator is a powerful trading tool that integrates three of the most reliable technical analysis methods: Bollinger Bands, Commodity Channel Index (CCI), and Relative Strength Index (RSI). By combining these indicators into a single system, the Da Vinci Indicator delivers precise entry and exit signals, helping traders capitalize on market trends with confidence. Designed for traders of all experience levels, this tool provides unmatched clarity in market dynamics.
How the Da Vinci Indicator Works
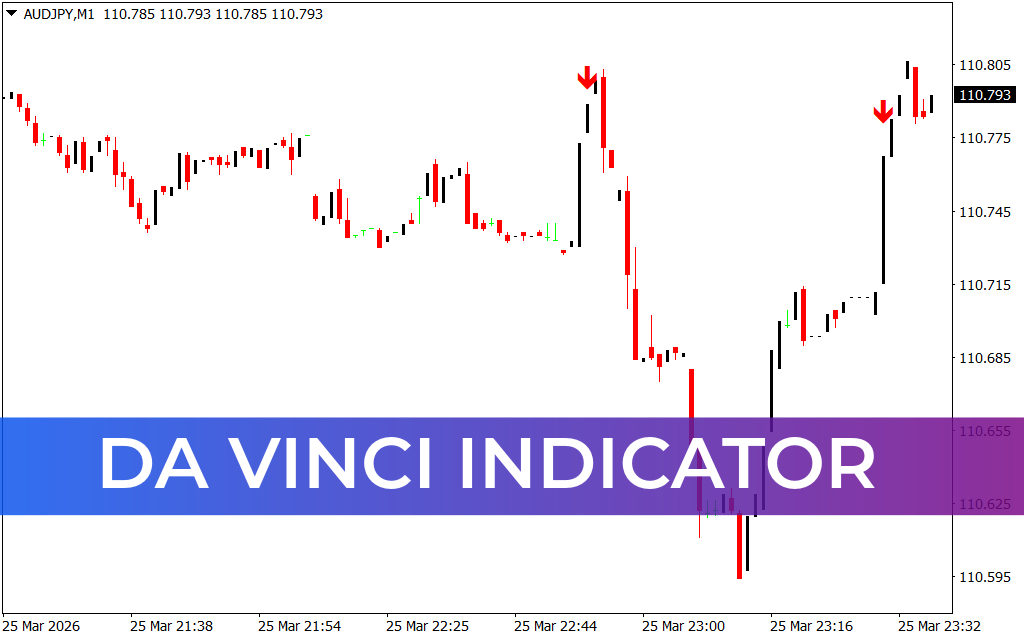
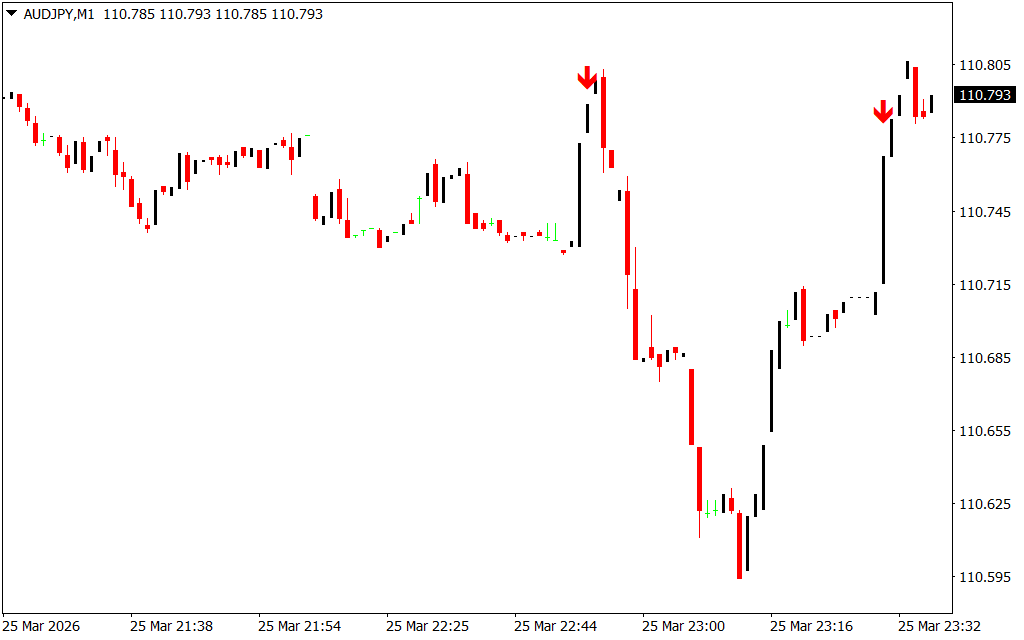
The Da Vinci Indicator analyzes the relationship between Bollinger Bands, CCI, and RSI to identify optimal trading opportunities:
- Buy Signals: When the CCI and RSI indicate oversold conditions and the price touches the lower Bollinger Band, a blue arrow appears, signaling a potential buy opportunity.
- Sell Signals: When the CCI and RSI suggest overbought conditions and the price interacts with the upper Bollinger Band, a red arrow signals a potential sell opportunity.
This multi-layered confirmation system reduces false signals, allowing traders to focus on high-probability setups and execute trades with greater accuracy. By combining these three indicators, the Da Vinci Indicator provides a robust framework for informed trading decisions.
Why Choose the Da Vinci Indicator
The Da Vinci Indicator stands out for its innovative approach and reliable performance. By merging three powerful tools into a cohesive system, it empowers traders to reduce risk and maximize profits. Whether navigating forex, stocks, or commodities, the Da Vinci Indicator delivers actionable insights to stay ahead of the market.
Download the Da Vinci Indicator today and elevate your trading strategy with confidence and precision.
FAQ
5 Downloads
Published:
Mar 25, 2026 18:42 PM
Category: