Free
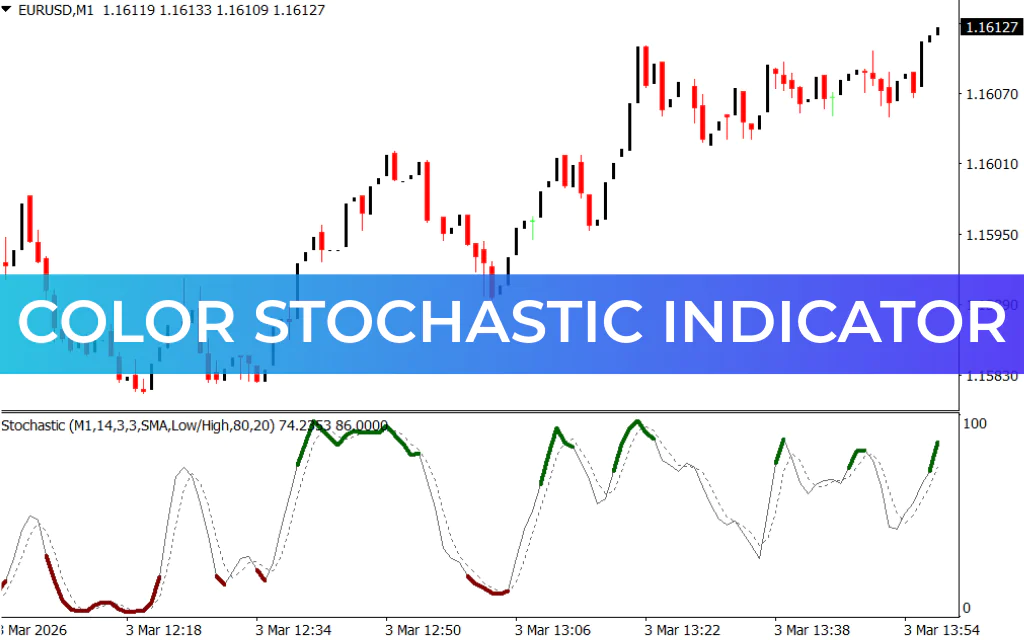
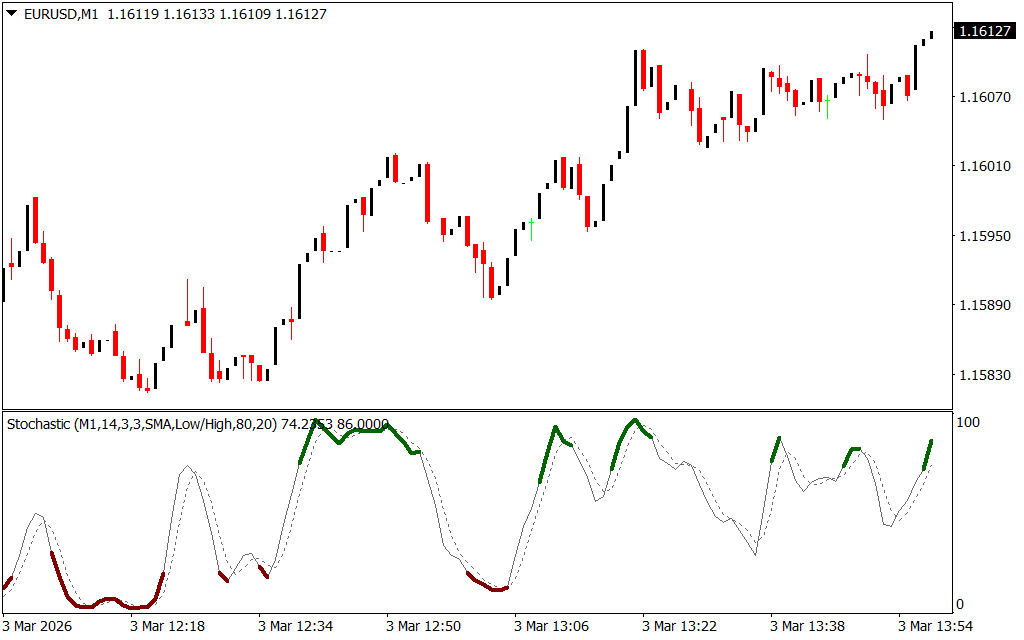
The Color Stochastic Indicator for MT4 is a modified stochastic oscillator that functions as a Momentum Indicator. By comparing the closing price of a financial asset with its price range over a selected timeframe, it helps traders anticipate potential price reversal points.
Key Features of the Color Stochastic Indicator
- Color-Coded Signals:
- Red: Oversold conditions, indicating a potential bullish reversal.
- Green: Overbought conditions, indicating a potential bearish reversal.
- Dual-Line Indicator: Fluctuates between 0 and 100, showing the relative position of current prices in the selected timeframe.
- Timeframe Flexibility: Typically uses 14 periods (e.g., 14 hours on an hourly chart, 14 weeks on a weekly chart).
- Beginner-Friendly: Color coding simplifies identifying overbought and oversold regions.
How to Use the Color Stochastic Indicator on MT4
- Long Setup:
- Indicator turns red signaling oversold conditions.
- Wait for a bullish candle to close to confirm entry.
- Place stop loss slightly below the candle low.
- Take profit at the next horizontal level or when the indicator reaches the overbought zone.
- Short Setup:
- Indicator turns green signaling overbought conditions.
- Wait for a bearish candle to close to confirm entry.
- Place stop loss just above the candle high.
- Exit at the next support level or when the indicator reaches the oversold zone.
Tips for Optimal Trading
- Combine with Trend Confirmation or support/resistance levels to reduce false signals.
- Works across all timeframes for Scalping, intraday, or swing trading strategies.
- Ideal for beginner traders due to its visual simplicity.
Conclusion
The Color Stochastic Indicator for MT4 provides color-coded insights into overbought and oversold conditions, helping traders identify potential market reversals. By integrating this tool into a trading strategy, traders can make more informed entry and exit decisions.
FAQ
Modified stochastic. Compares closing price with price range. Red = oversold, potential bullish reversal. Green = overbought, potential bearish reversal. Dual-line, fluctuates 0-100. Typically 14 periods. Color coding simplifies identification.
Indicator turns red (oversold). Wait for bullish candle to close to confirm. Place stop loss slightly below candle low.
Indicator turns green (overbought). Wait for bearish candle to close to confirm. Place stop loss slightly above candle high.
Momentum traders. Beginner-friendly. MT4.
Potential price reversal points. Overbought/oversold regions.
1 Download
Published:
Mar 03, 2026 08:00 AM
Category:
Share: