The Color RSI Indicator for MT5 is an upgraded version of the classic RSI (Relative Strength Index), designed to make trading decisions faster and more intuitive. By adding color-coded signals and visual cues, this indicator simplifies the process of identifying overbought and oversold market conditions.
With built-in BUY and SELL signals, it helps traders quickly spot potential opportunities without needing complex analysis.
How the Color RSI Indicator Works
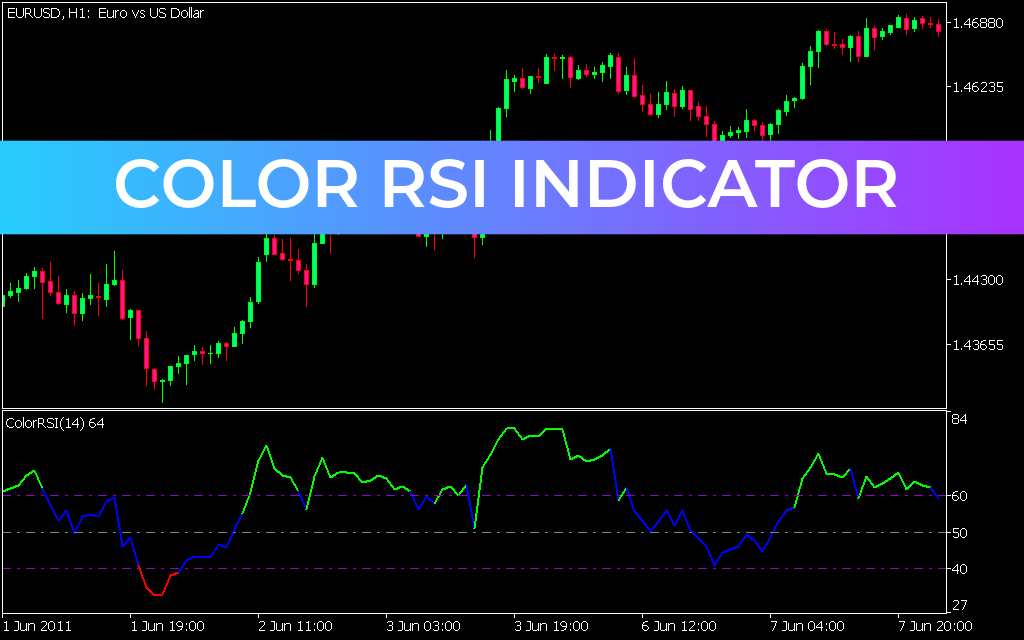
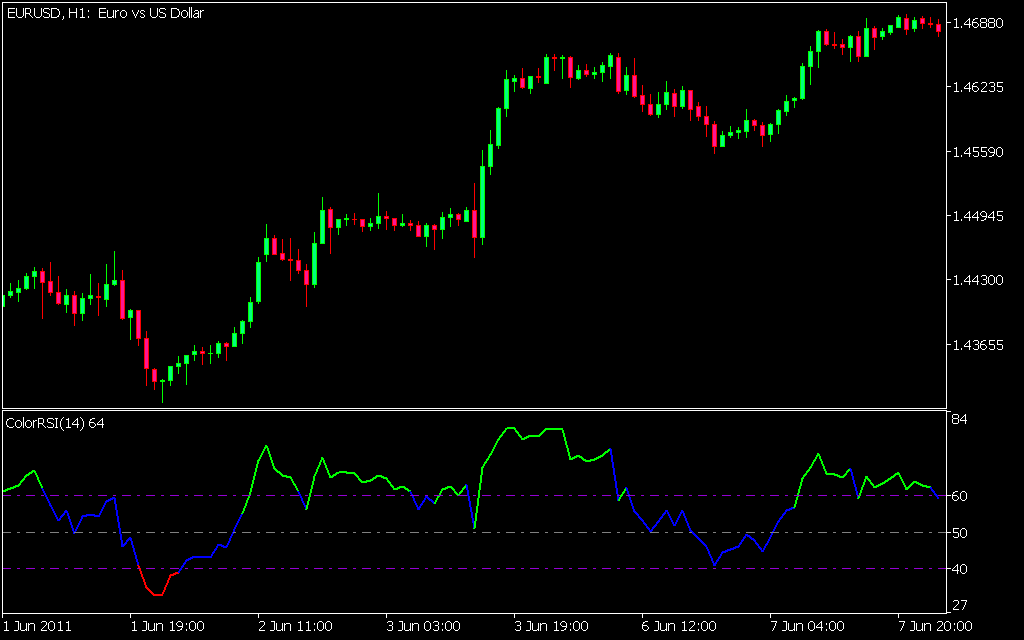
The Color RSI modifies the traditional RSI by introducing color-based signals within the oscillator window. These colors represent different market conditions:
- Red zone → Oversold market (potential BUY signal)
- Green zone → Overbought market (potential SELL signal)
- Blue zone → Neutral market conditions
This visual approach allows traders to instantly understand market momentum and act accordingly.
Key Features of the Indicator
- Color-coded RSI for easy signal recognition
- Built-in BUY and SELL signals
- Works on all timeframes (M15, H1, Daily, Weekly, Monthly)
- Suitable for beginners and advanced traders
- Helps identify trend reversals and momentum shifts
- Free to download and easy to install
Understanding Trading Signals
The Color RSI uses slightly adjusted levels compared to the traditional RSI:
- Below 40 → Oversold (Red) → Potential BUY signal
- Above 60 → Overbought (Green) → Potential SELL signal
- Between 40–60 → Neutral (Blue)
Buy Trading Strategy
When the indicator turns red:
- RSI falls below 40 (oversold condition)
- Expect a bullish reversal
- Enter a BUY trade
- Place a stop-loss below the previous swing low
- Take profit when:
- Opposite signal appears, or
- Risk/reward ratio exceeds 1:2
Sell Trading Strategy
When the indicator turns green:
- RSI rises above 60 (overbought condition)
- Expect a bearish reversal
- Enter a SELL trade
- Place a stop-loss above the previous swing high
- Exit when:
- Opposite signal appears, or
- Target risk/reward is achieved
Multi-Timeframe Trading Strategy
To improve accuracy:
- Use higher timeframes to identify the main trend
- Use lower timeframes to fine-tune entries and exits
This approach helps traders align with the broader market direction while optimizing entry points.
Best Practices for Better Results
- Combine with candlestick patterns for confirmation
- Use support and resistance levels
- Apply proper risk management
- Avoid trading during low volatility or sideways markets
Advantages of the Color RSI Indicator
- Eliminates confusion of traditional RSI readings
- Provides clear visual signals
- Speeds up decision-making
- Works across all trading styles and markets
Conclusion
The Color RSI Indicator for MT5 enhances the traditional RSI by adding visual clarity and actionable trading signals. With its color-coded system, traders can quickly identify overbought and oversold conditions and make better trading decisions.
It’s an excellent tool for both beginners and experienced traders looking to improve their technical analysis and capture high-probability trade setups.
Meta Description
21 Downloads
Published:
Apr 14, 2026 13:02 PM
Category: