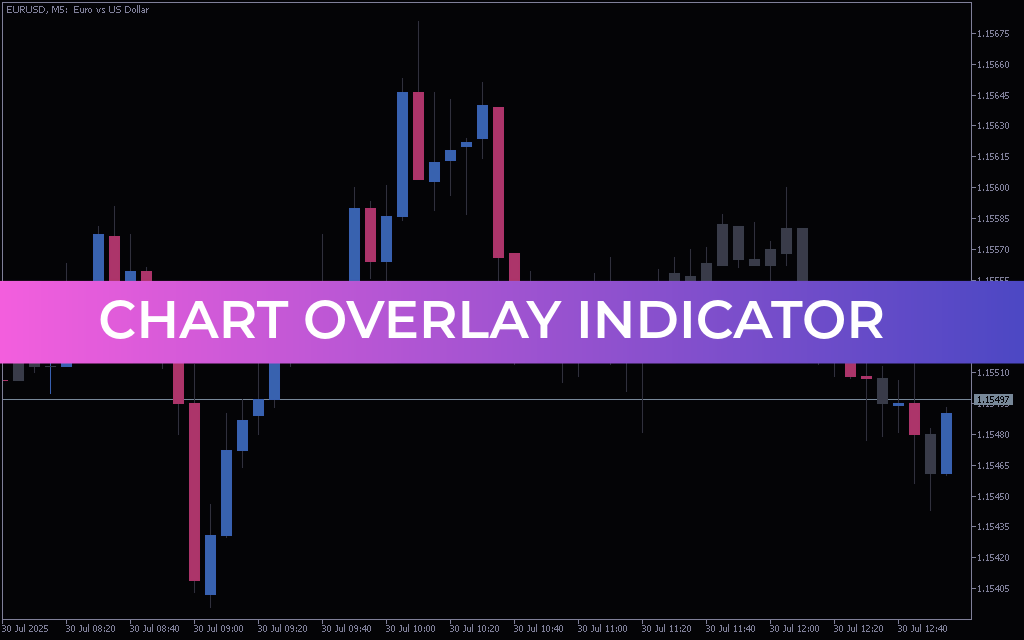
The Chart Overlay Indicator for MetaTrader 5 (MT5) is an innovative visualization tool designed to enhance chart readability by modifying the appearance of candlesticks based on market conditions such as volume, trend strength, or price activity. Instead of generating trading signals, it focuses on improving how traders interpret Price Action.
By adjusting candle opacity, color themes, and visual contrast, this indicator helps traders filter out market noise and focus on meaningful price movements, making analysis more efficient and visually intuitive.
How the Chart Overlay Indicator Works
This indicator enhances chart presentation rather than producing buy or sell signals. It dynamically modifies candle visuals based on:
- Trend Strength
- Market volatility
- Volume or price activity
- Custom user settings
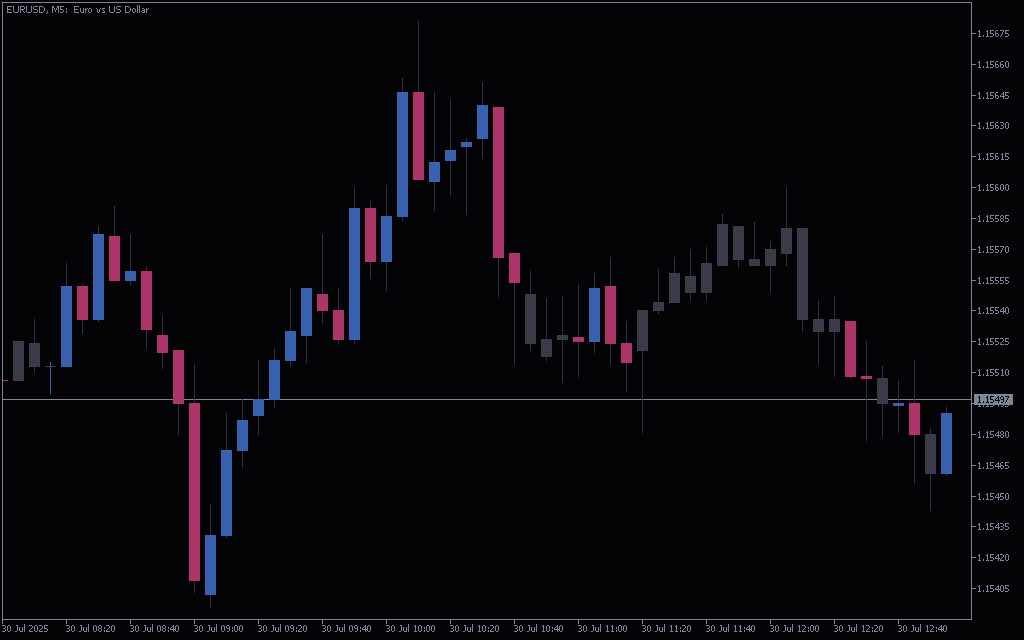
Traders can control how candles appear, allowing them to highlight strong movements while muting less significant price action.
Key Visualization Features
- Adjustable candle opacity (transparency)
- Custom color themes for bullish and bearish trends
- Enhanced contrast for better chart readability
- Noise reduction for cleaner price action analysis
- Real-time adaptation to market conditions
This makes it easier to visually distinguish between strong trends and weak or consolidating markets.
Trading Insights (Not Signals)
The Chart Overlay Indicator does not generate direct trading signals. Instead, it provides visual insights:
- Highlighted Candles: Indicate strong momentum or high activity
- Muted Candles: Suggest lower interest or weak market movement
- Color Differences: Help identify trend direction and potential reversals
Traders can use these visual cues alongside their existing strategies for better decision-making.
How to Use Chart Overlay Indicator
- Apply the indicator to your MT5 chart
- Adjust candle opacity and color settings based on preference
- Observe how candles change during different market conditions
- Combine with price action strategies or other indicators
- Use visual clarity to identify trends, reversals, and consolidation zones
Key Features
- Advanced chart visualization tool
- Improves readability of price action
- Customizable candle appearance
- Filters out market noise
- Works on all timeframes and assets
- Suitable for all trading styles
Best Usage Tips
- Combine with price action strategies for better analysis
- Use alongside indicators like RSI, moving averages, or volume tools
- Adjust settings based on market volatility
- Apply on higher timeframes for clearer trend identification
- Focus on strong visual signals rather than cluttered data
Who Should Use This Indicator?
- Price Action Traders – for clearer candlestick interpretation
- Scalpers – for quick visual clarity in fast markets
- Trend Traders – to better identify strong movements
- Beginners – to simplify chart analysis
Conclusion
The Chart Overlay Indicator for MT5 is a powerful visualization tool that enhances chart clarity rather than generating signals. By customizing candle appearance and reducing market noise, it allows traders to focus on important price movements and trends.
Whether you are analyzing volatile markets or refining your price action strategy, this indicator provides a cleaner, more efficient way to interpret market behavior and improve overall trading insight.
FAQ
1 Download
Published:
Mar 23, 2026 12:51 PM
Category: