The Chande Kroll Stop Indicator is a powerful Forex trading tool designed to help traders determine the optimal stop loss level with precision. By using volatility-based calculations, it ensures your trades are protected while allowing room for price movement.
Developed by Tushar Chande and Stanley Kroll, this indicator uses the Average True Range (ATR) along with directional movement to calculate dynamic stop levels. One of its key advantages is that it remains reliable even during volatile market conditions.
What is the Chande Kroll Stop Indicator?
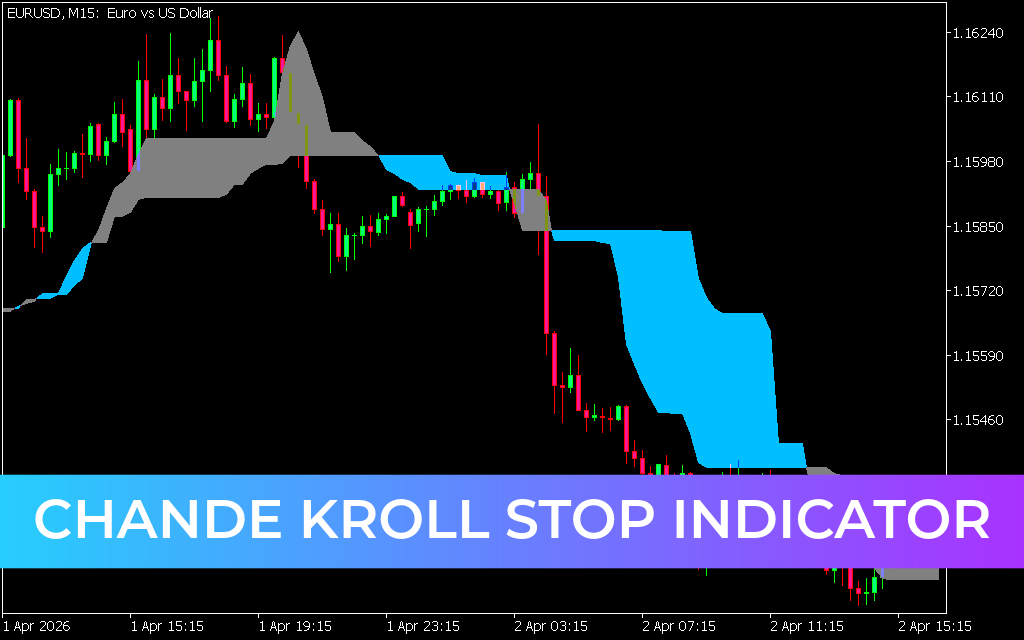
The Chande Kroll Stop Indicator plots two lines on the chart:
- Long Stop Line
- Short Stop Line
The area between these lines is highlighted in blue or gray, depending on which line is dominant. These zones act as dynamic trailing stop levels, helping traders manage risk effectively.
Unlike traditional stop loss methods, this indicator adapts to price movement while filtering out unnecessary noise caused by volatility.
Key Features
- Volatility-based stop loss calculation
- Dynamic trailing stop levels
- Works on all trading instruments
- Compatible with all timeframes
- Clear buy and sell signals
- Helps protect profits and manage risk
How to Set the Chande Kroll Stop Indicator
Using the indicator is straightforward:
- Add it to your chart
- Adjust settings if needed (ATR period, multipliers, colors)
- Observe the two stop lines and colored zones
The indicator automatically follows price movement and updates stop levels in real time, allowing you to manually set trailing stops based on its signals.
How to Trade with the Chande Kroll Stop Indicator
Before entering trades, it’s important to understand how the indicator behaves in different market conditions.
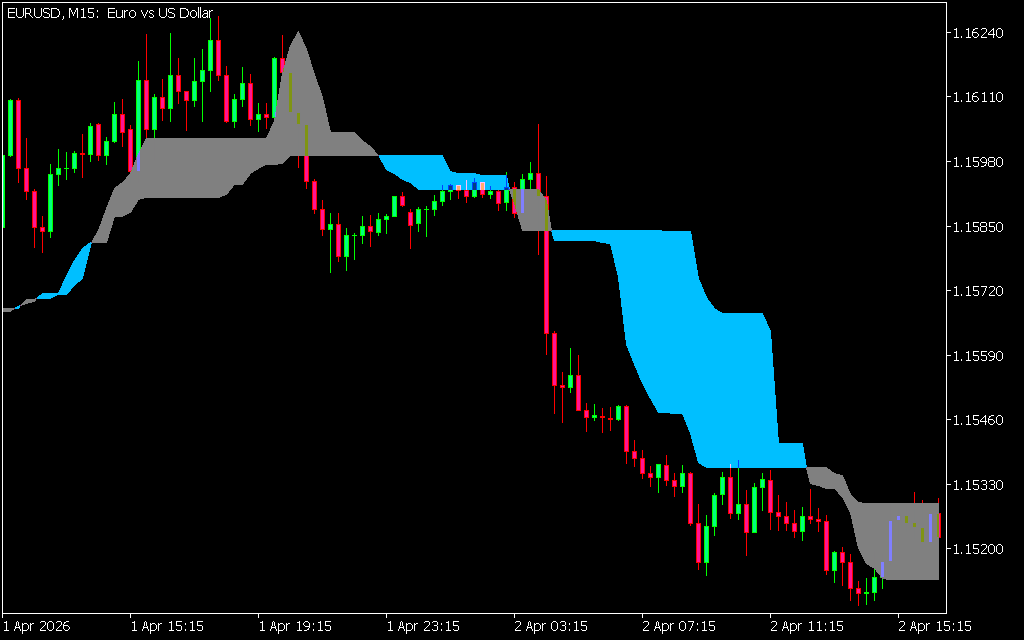
Bullish Market (Uptrend)
- Stop level = Top of blue zone or bottom of gray zone
- Indicator follows the price upward
- Stop line remains fixed when price weakens
👉 Buy Signal:
Occurs when the zone changes from gray to blue, indicating a potential uptrend.
Ensure price is above the trend line for confirmation.
Bearish Market (Downtrend)
- Stop level = Bottom of gray zone or top of blue zone
- Indicator tracks price downward
- Lines remain steady during temporary pullbacks
👉 Sell Signal:
Occurs when the zone changes from blue to gray, signaling a possible downtrend.
Confirm that price is below the trend line.
Exit Strategy
- Close long trades when price enters the blue zone
- Close short trades when price enters the gray zone
These zones act as trailing stop losses, helping you lock in profits and reduce risk.
Trading Example
Imagine a chart showing the GBP/USD currency pair:
- The zone changes from gray to blue → Buy signal
- Price moves upward and stays above the blue zone → Trend Confirmation
- The blue zone acts as a trailing stop loss
Later:
- The indicator flattens → trend weakening
- Zone changes back to gray → Sell signal
- Price drops below the zone → confirms downtrend
This sequence demonstrates how the indicator can guide both entries and exits effectively.
Why Use the Chande Kroll Stop Indicator?
This indicator is ideal for traders who want to:
- Protect profits with precision
- Avoid premature stop-outs
- Follow trends confidently
- Automate stop loss placement
It not only minimizes risk but also helps identify strong entry and exit points.
Conclusion
The Chande Kroll Stop Indicator is an essential tool for traders looking to improve risk management and protect profits. Its dynamic trailing stop system ensures that winning trades remain profitable while minimizing losses.
By combining this indicator with proper strat
2 Downloads
Published:
Apr 12, 2026 08:46 AM
Category: