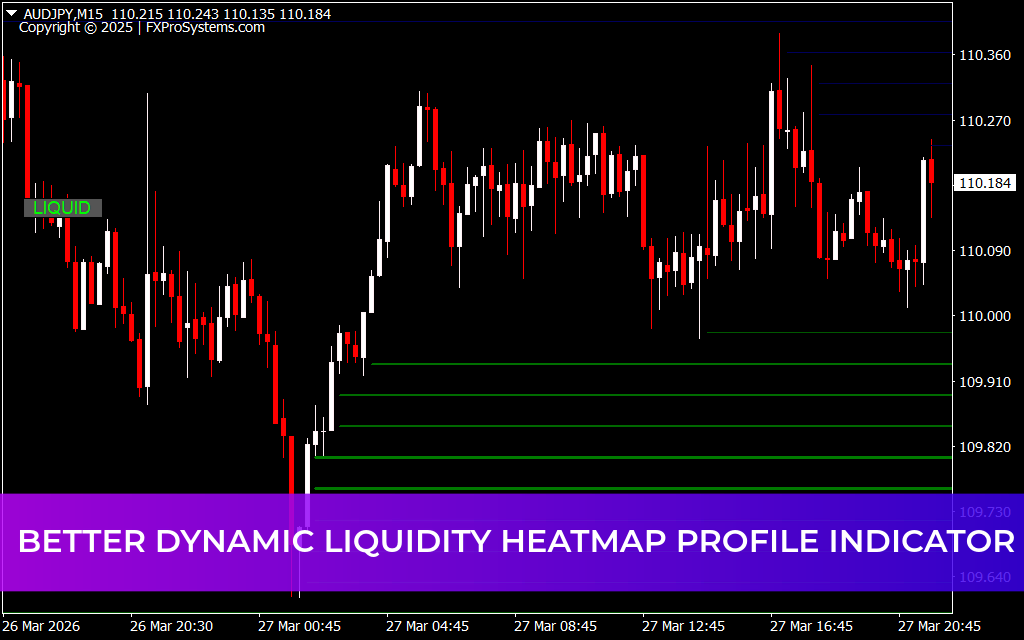
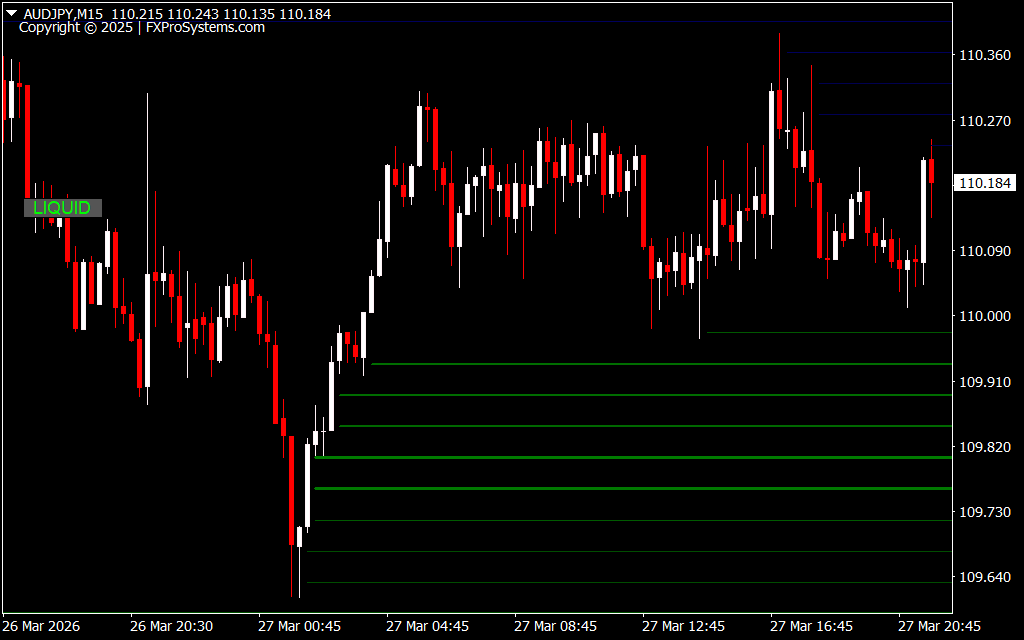
The Better Dynamic Liquidity HeatMap Profile Indicator is a visualization tool for Market Structure and liquidity, designed to help traders identify areas where institutional order flow and high-volume trades are concentrated. Unlike traditional Support And Resistance tools, this indicator maps zones of liquidity dynamically, providing a real-time heatmap of market activity that can guide entries, exits, and risk management.
How the Better Dynamic Liquidity HeatMap Profile Works
This indicator focuses on price level–liquidity density relationships:
- Horizontal Liquidity Lines: Show regions with the highest concentration of trading activity. Thicker lines indicate stronger Liquidity Zones.
- Dynamic Heatmap: Displays on the right side of the chart, highlighting areas where the market has previously clustered orders.
- Market Reaction Potential: Price tends to gravitate toward high-liquidity zones, often resulting in reversals, pullbacks, or breakout continuations.
By mapping where institutional traders are likely active, the tool gives a statistical view of potential reaction sites, enhancing situational awareness without generating explicit buy or sell signals.
Trading Signals and Applications
The Better Dynamic Liquidity HeatMap is not a direct signal generator, but it provides actionable insights:
- Support and Resistance Validation: High-liquidity zones often act as natural support in downtrends or resistance in uptrends.
- Anticipating Market Reactions: Price often pauses, consolidates, or reverses at high-volume nodes.
- Trend Context: Use in conjunction with market structure, session volatility, and trend direction to identify high-probability setups.
- Breakout and Pullback Zones: Dense liquidity areas can serve as targets for breakout continuations or retracement entries.
Traders benefit most when combining liquidity heatmaps with Price Action analysis, as this synergy often highlights stronger trade setups.
Key Benefits
- Visualizes Institutional Interest: See where large traders are active in real-time.
- Dynamic Heatmap: Adapts as the market evolves, unlike static S/R indicators.
- Enhances Trade Context: Identifies zones likely to cause volatility or reaction.
- Supports Multiple Strategies: Useful for order flow traders, market structure analysts, and institutional liquidity-focused approaches.
- Improves Risk Management: Knowing where liquidity clusters exist can help define stop-loss and take-profit levels more effectively.
Conclusion
The Better Dynamic Liquidity HeatMap Profile Indicator for MT4 is a powerful tool for traders seeking insight into market liquidity and institutional activity. By visualizing the density of high-volume zones, it provides context that goes beyond standard support and resistance, helping traders anticipate price reactions more reliably.
For those who focus on order flow, market structure, and institutional liquidity, this indicator offers a valuable edge, enhancing trade selection and improving situational awareness.
FAQ
3 Downloads
Published:
Mar 29, 2026 10:03 AM
Category: