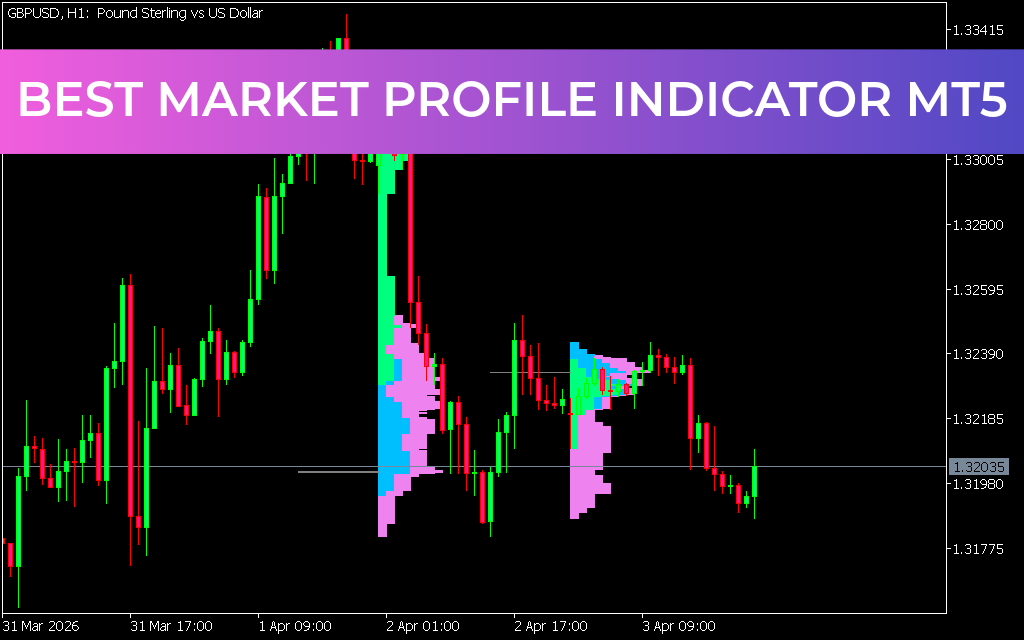
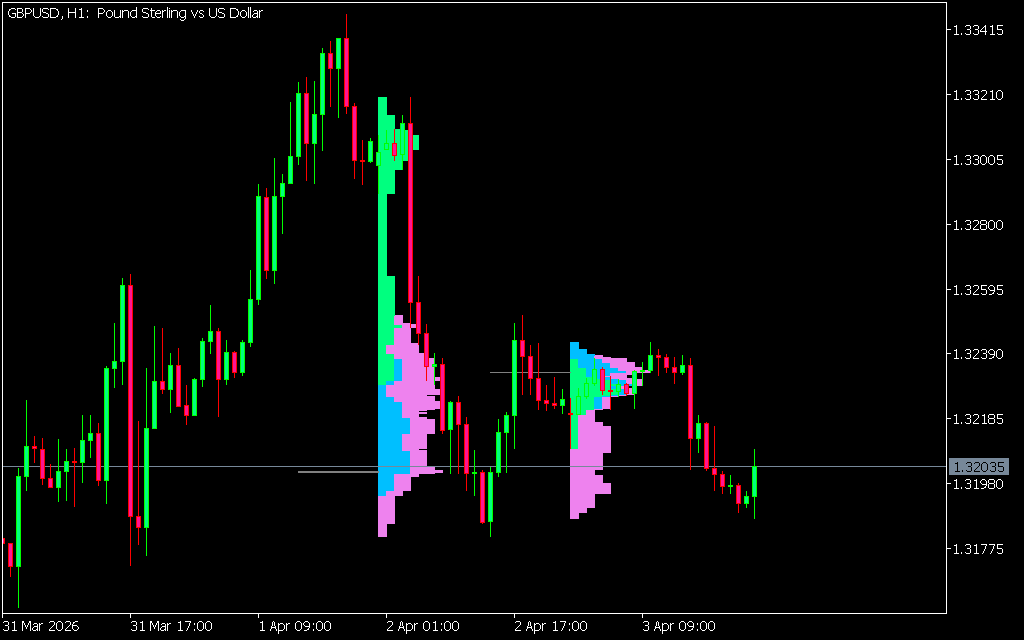
The Market Profile Indicator is a powerful tool that displays price density over time, highlighting the most important price levels, ranges, and benchmarks for a specific trading session. By combining volume, time, and tick data, the Market Profile helps traders understand where the majority of trading activity occurs, offering insights into Supply And Demand zones.
The MP Trendlines Indicator is a variation of the traditional Market Profile, enhanced with trendlines to make price analysis more intuitive.
What is the Market Profile Trendlines Indicator?
Originally developed at the Chicago Board of Trade (CBOT), the Market Profile was designed to present price and time information in a clear, visual format.
- Histogram Display: Shows active trading activity at specific price levels.
- Trendlines: Added to highlight key price zones and directional bias.
- Tick Data: Uses every tick for precise calculations.
- Session Profiles: Can be applied to timeframes from M1 to D1, displaying session-based profiles.
Unlike traditional indicators, Market Profile focuses purely on Price Action, without relying on standard MT4/MT5 tools.
How to Use the Market Profile Indicator
The value area is the core concept of Market Profile. It represents the midpoint between supply and demand levels during a session.
- Upper Tail: Indicates sellers dominating at higher price levels.
- Lower Tail: Indicates buyers dominating at lower price levels.
- Rejected Areas: Large tails suggest strong rejection zones, useful for identifying reversals.
Trading Strategies with Market Profile
- Buy Setup:
- Identify the lower boundary of the value area.
- Wait for bullish price action.
- Place stop-loss near the recent low.
- Exit when the trend changes direction.
- Sell Setup:
- Identify the upper boundary of the value area.
- Wait for bearish confirmation.
- Place stop-loss near the recent high.
- Exit when the trend changes direction.
Advantages
- Highlights key supply and demand zones.
- Works across all timeframes and markets (Forex, stocks, commodities).
- Provides deeper insights than traditional volume indicators.
- Can be combined with other tools like moving averages or RSI for confirmation.
Conclusion
The Market Profile Trendlines Indicator for MT5 is an advanced tool for analyzing price density and value areas. By identifying where the majority of trading activity occurs, it helps traders anticipate future price movements. While best used alongside other technical indicators, it remains one of the most effective ways to understand Market Structure and volatility.
2 Downloads
Published:
Apr 04, 2026 23:41 PM
Category: