The Balance of Market Power (BMP) Indicator for MetaTrader (MT4/MT5) is a powerful technical analysis tool designed to measure the strength of buying and selling pressure in the market. By analyzing the dominance of bulls and bears, this indicator helps traders anticipate potential trend movements and identify high-probability trading opportunities.
Whether you're a beginner or an experienced trader, the BMP Indicator offers valuable insights into market momentum and sentiment.
What is the Balance of Market Power Indicator?
The Balance of Market Power Indicator evaluates Price Action by analyzing the relationship between:
- Close price
- Open price
- High price
- Low price
It uses a 14-period moving average to smooth out fluctuations and present a clear view of market strength.
This allows traders to:
- Identify trend direction
- Detect overbought and oversold conditions
- Spot trend continuation and reversal signals
How Does the BMP Indicator Work?
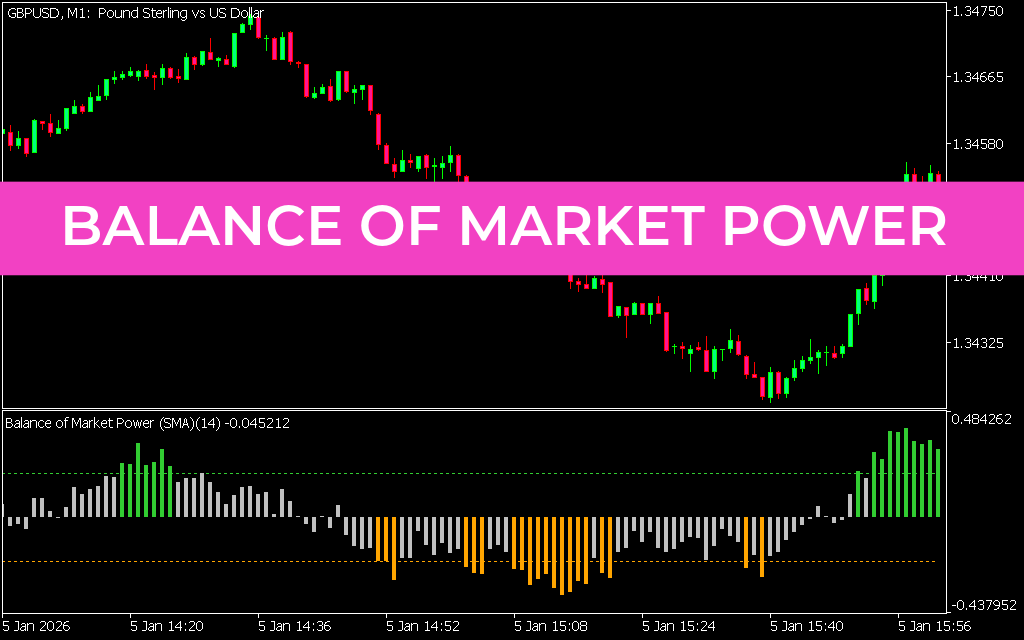
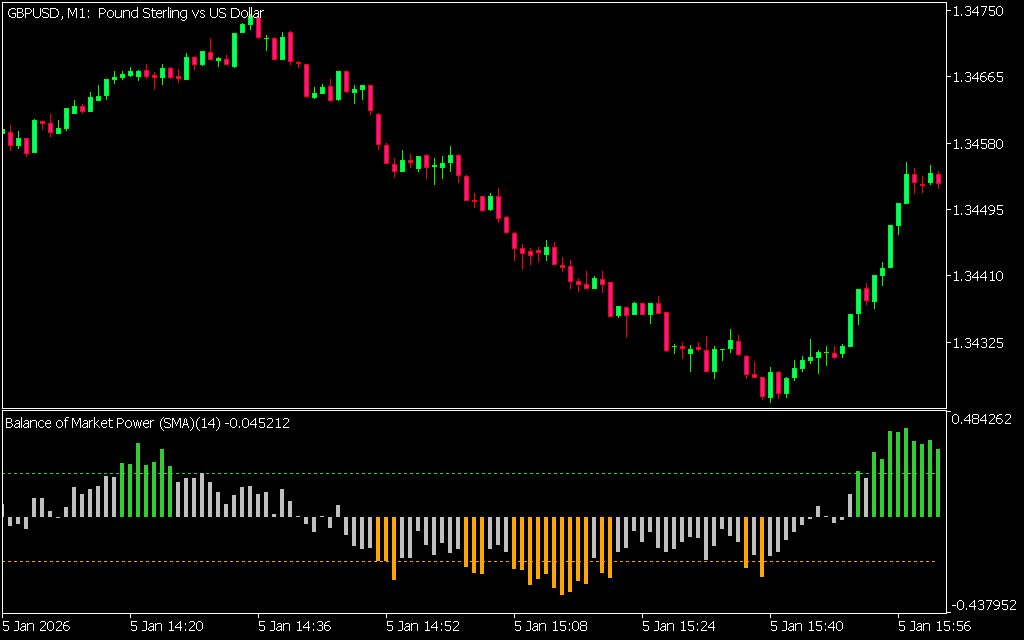
The BMP Indicator is displayed as a histogram that fluctuates around a zero line, which acts as a key reference point.
Signal Interpretation:
- Above Zero Line → Strong bullish pressure (buyers in control)
- Below Zero Line → Strong bearish pressure (sellers in control)
Visual Representation:
- Light/Lime bars above zero → Bullish momentum
- Red bars below zero → Bearish momentum
The position and color of the histogram bars provide quick and clear insights into market sentiment.
Key Features of the BMP Indicator
- Measures buying vs selling strength
- Identifies market momentum shifts
- Detects overbought and oversold levels
- Works across multiple timeframes
- Suitable for Scalping, intraday, and swing trading
How to Trade with the Balance of Market Power Indicator
For best performance, combine the BMP Indicator with price action or candlestick confirmation patterns.
BUY Signal (Long Entry)
A strong BUY setup occurs when:
- Histogram bars move above the zero line
- Bullish momentum is increasing
- A bullish engulfing pattern confirms the entry
This indicates strong buyer control and potential upward movement.
SELL Signal (Short Entry)
A strong SELL setup occurs when:
- Histogram bars move below the zero line
- Bearish momentum is increasing
- A bearish engulfing pattern confirms the signal
This reflects strong selling pressure and potential downward movement.
Trading Example
On a GBP/USD H1 chart:
- A BUY signal is confirmed when lime histogram bars rise above the zero line alongside a bullish engulfing pattern
- A SELL signal occurs when red histogram bars fall below zero and align with a bearish engulfing pattern
This combination of indicator signals and price action improves trade accuracy.
Why Use the BMP Indicator?
Traders rely on the Balance of Market Power Indicator because it:
- Clearly shows market dominance (bulls vs bears)
- Enhances trade timing and accuracy
- Works well with multiple trading strategies
- Simplifies technical analysis
Conclusion
The Balance of Market Power Indicator is a reliable and effective tool for evaluating market strength and momentum. By understanding the balance between buyers and sellers, traders can make more informed decisions and improve their trading performance.
When combined with price action, it becomes a powerful strategy for identifying high-probability trade setups.
Best of all, the Balance of Market Power Indicator is completely free to download, making it an excellent addition to any trading toolkit.
3 Downloads
Published:
Apr 11, 2026 04:15 AM
Category: