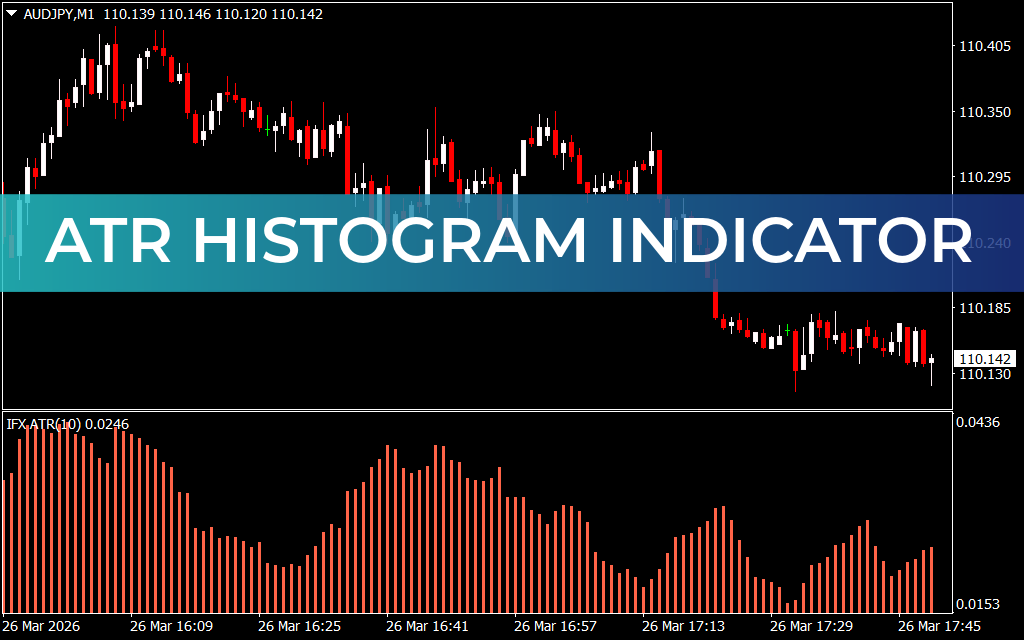
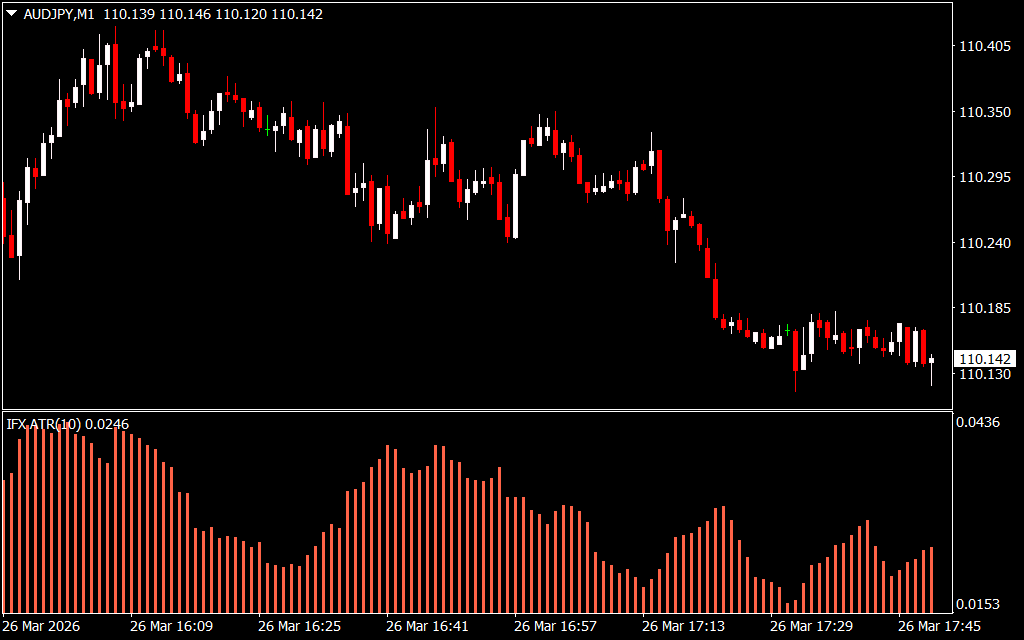
The ATR Histogram Indicator for MT4 is a powerful tool that provides a clear visual representation of market volatility. Built on the Average True Range (ATR), this indicator displays ATR values as a histogram, making it easier for traders to track volatility changes over time.
By analyzing these fluctuations, traders can make better decisions about trade entries and exits, optimize stop-loss levels, and manage risk more effectively. Its intuitive design makes it suitable for both beginners and experienced traders across all timeframes and trading strategies.
ATR Histogram Indicator Trading Signals
The indicator displays a histogram where each bar represents the level of market volatility during a specific period:
- High Bars: Indicate increased volatility, often signaling potential breakout opportunities.
- Low Bars: Reflect low volatility, suggesting consolidation or range-bound market conditions.
Trading Strategies:
- Breakout Trading:
- Look for high volatility (taller bars) to identify potential breakout trades.
- Range Trading:
- Use low volatility (shorter bars) to trade within Support And Resistance levels.
- Risk Management:
- Adjust stop-loss levels based on current volatility—wider stops in high volatility and tighter stops in low volatility environments.
By monitoring volatility levels, traders can adapt their strategies to current market conditions and avoid unnecessary risks.
Why Use the ATR Histogram Indicator?
- Provides a clear and visual representation of market volatility
- Helps identify optimal trading conditions (breakouts vs ranges)
- Improves stop-loss placement and risk management
- Works across all timeframes and trading styles
The ATR Histogram Indicator for MT4 is an essential tool for traders looking to understand market volatility and make smarter, data-driven trading decisions.
Download the ATR Histogram Indicator for MT4 today and gain better control over your trading with accurate volatility insights!
FAQ
Published:
Mar 26, 2026 12:51 PM
Category: