The ATM Pure Breakout Zone Indicator for MT4 is a simple yet effective tool for identifying market breakouts. In forex trading, a breakout occurs when price moves above resistance or below support, signaling a potential trend direction.
By highlighting breakout zones, this indicator helps traders know when to enter or exit positions, making breakout trading more systematic and less subjective.
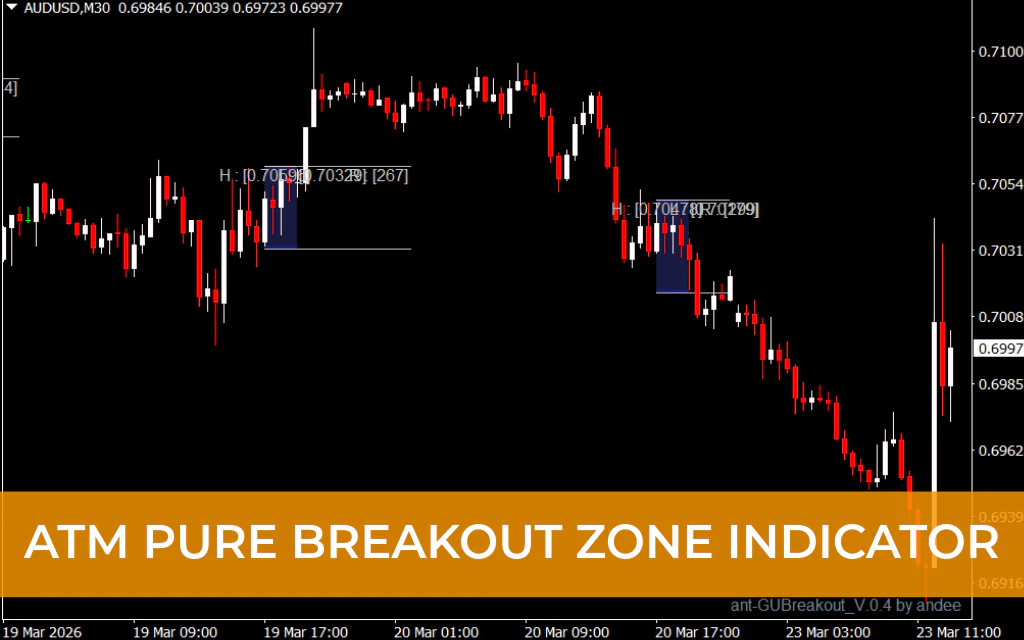
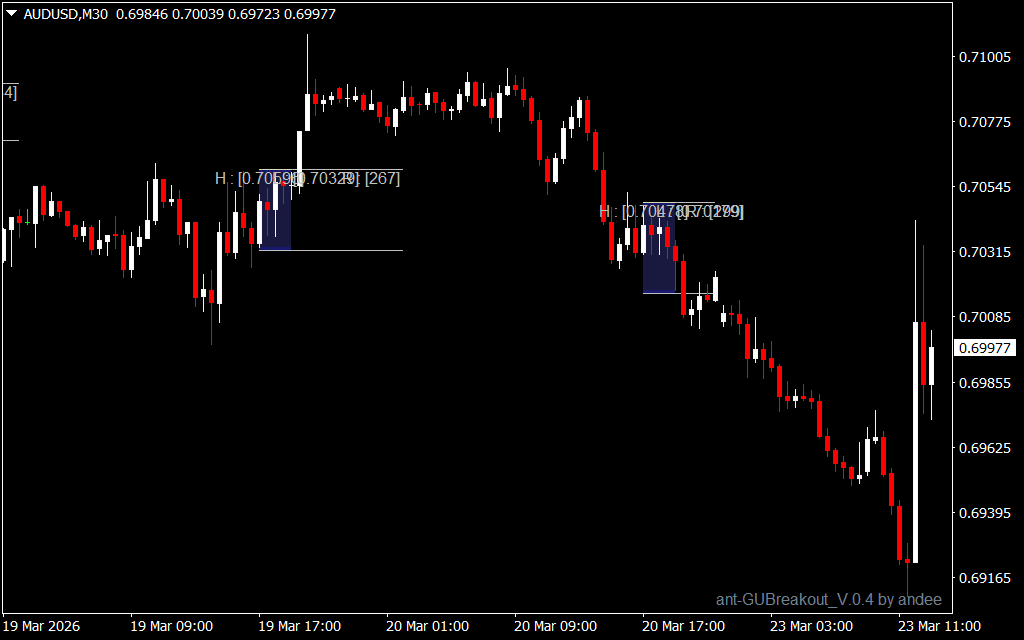
How the ATM Pure Breakout Zone Indicator Works
The indicator plots black lines on the chart to mark key breakout zones. When the price crosses these lines:
- Above the breakout zone → Buy signal
- Below the breakout zone → Sell signal
Example: On a USD/JPY M30 chart, when price breaks above the indicator’s zone in an uptrend, it signals a BUY opportunity. Conversely, when it breaks below the zone in a downtrend, it signals a SELL opportunity.
Confirming Breakouts with Volume Indicators
Volume plays a crucial role in breakout trading. To confirm a breakout, traders can use indicators like:
- On-Balance Volume (OBV)
- Money Flow Index (MFI)
A strong volume increase during a breakout helps validate the signal, reducing the chance of false breakouts.
Advantages of the ATM Pure Breakout Zone Indicator
- Clearly marks breakout zones for easier trade decisions
- Suitable for all timeframes
- Works for both novice and experienced traders
- Can be combined with volume indicators for higher accuracy
- Helps identify trend direction after breakouts
Conclusion
The ATM Pure Breakout Zone Indicator for MT4 simplifies trading by highlighting key breakout zones and signaling the likely direction of price movements. By confirming breakouts with volume indicators, traders can make informed buy or sell decisions with higher confidence.
You can download the ATM Pure Breakout Zone Indicator for free and integrate it into your MT4 platform to enhance your breakout trading strategy.
FAQ
1 Download
Published:
Mar 23, 2026 08:21 AM
Category: