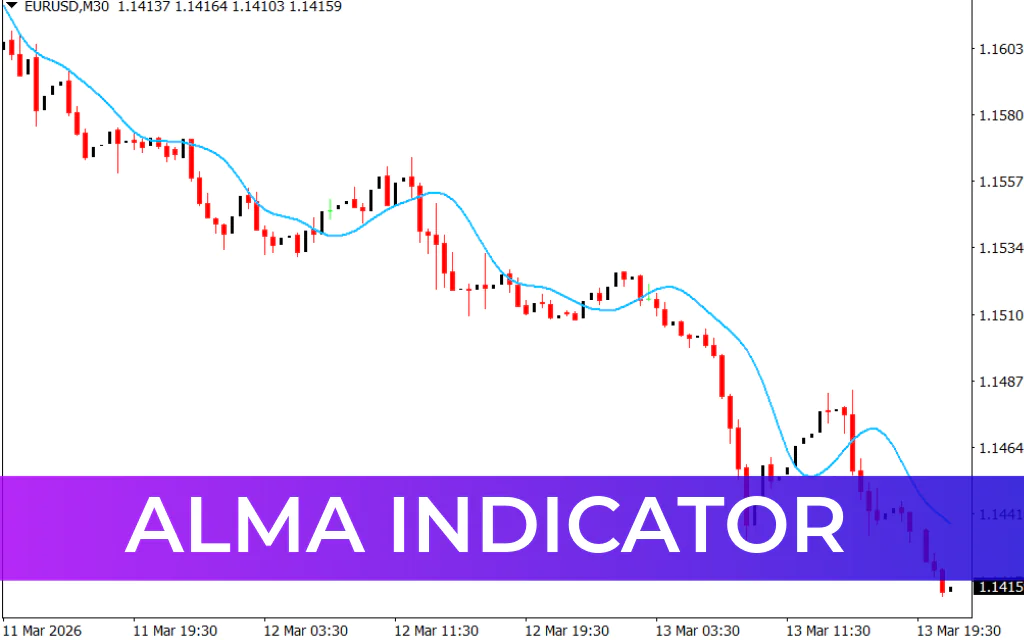
The ALMA Indicator is an advanced version of the traditional Moving Average designed to improve two major limitations of classic moving averages: responsiveness and smoothness. Developed by Arnaud Legoux, the indicator provides smooth and highly responsive trading signals with minimal lag.
Because of its optimized calculation method, the ALMA indicator helps traders identify market trends more accurately using technical analysis. It reduces noise while still reacting quickly to price changes, making it useful for both short-term and long-term trading strategies.
The indicator works seamlessly with MetaTrader 4 and can be applied to all timeframes, including intraday charts as well as daily, weekly, and monthly charts.
How the ALMA Indicator Works
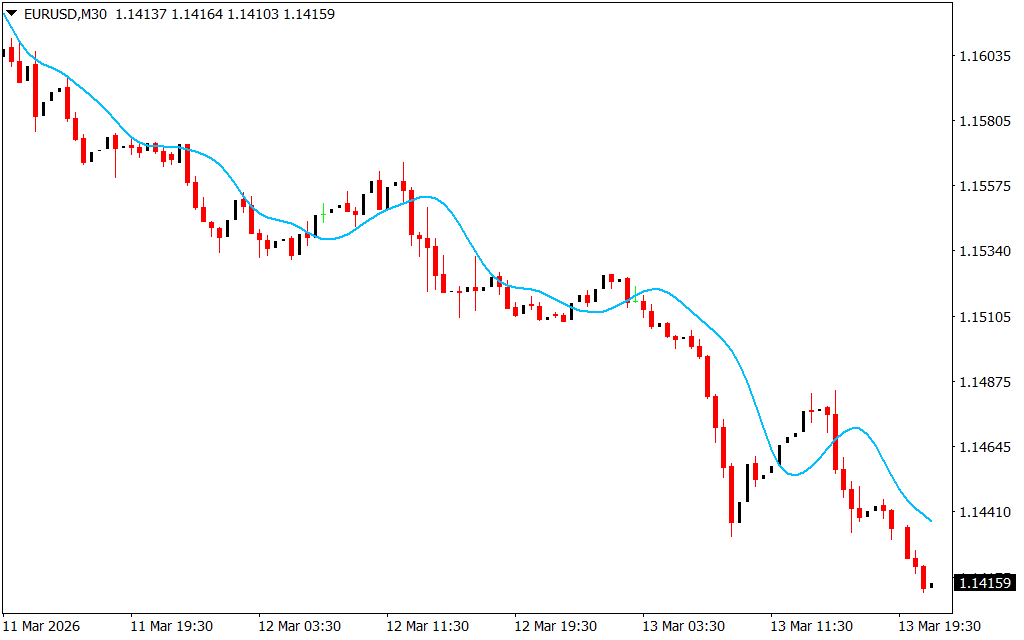
The ALMA indicator plots a smooth blue line directly on the price chart. This line acts as a dynamic Trend Indicator and helps traders determine the direction of the market.
One of the main problems with standard moving averages is lag:
- Short-period averages react quickly but often generate false signals.
- Long-period averages are more stable but produce late entries.
The ALMA indicator solves this issue by applying a Gaussian distribution smoothing method, allowing it to remain smooth while still responding quickly to price movements.
This balance makes it easier for traders to spot trend changes early without excessive market noise.
ALMA Indicator Trading Signals
The ALMA indicator generates signals based on price crossovers with the ALMA line.
Bullish Signal (Buy)
A buy signal occurs when:
- The price crosses the ALMA line from below to above.
- A candlestick closes above the ALMA line.
- This confirms the beginning of a bullish trend.
Trade Setup:
- Enter a BUY position after the bullish crossover.
- Place the stop-loss below the previous swing low.
- Take profit at the opposite signal or maintain a strong risk-to-reward ratio.
Bearish Signal (Sell)
A sell signal occurs when:
- The price crosses the ALMA line from above to below.
- The candlestick closes below the ALMA line.
- This indicates the start of a bearish trend.
Trade Setup:
- Enter a SELL position after the bearish crossover.
- Place the stop-loss above the previous swing high.
- Take profit at the opposite signal or with a favorable risk-reward ratio.
Multi-Timeframe Trading with ALMA
The ALMA indicator performs particularly well in multi-timeframe analysis (MTF).
Example strategy:
- Use a higher timeframe to identify the overall market trend.
- Switch to a lower timeframe to find precise entry points using ALMA crossovers.
This top-down analysis approach helps traders improve entry timing and reduce false signals.
Benefits of the ALMA Indicator
- Provides smooth yet responsive trend signals
- Reduces lag compared to traditional moving averages
- Works on all trading timeframes
- Suitable for manual trading and automated strategies
- Ideal for both beginner and advanced traders
Many traders also combine ALMA with oscillators like the Relative Strength Index (RSI) or Moving Average Convergence Divergence (MACD) to confirm signals and improve trading accuracy.
Conclusion
The ALMA Indicator for MT4 offers a powerful improvement over traditional moving averages by providing faster and smoother trend signals. Its ability to reduce lag while maintaining accuracy makes it a valuable tool for traders looking to identify trend direction and potential entry points.
Whether you are a beginner learning trend analysis or an experienced trader using multi-timeframe strategies, the ALMA indicator can significantly enhance your trading approach. For best results, combine it with Price Action analysis or momentum indicators for additional confirmation.
FAQ
15 Downloads
Published:
Mar 14, 2026 08:03 AM
Category: