The All Volume Average Indicator for MT4 is a simple yet powerful tool designed to help traders analyze market volume activity directly on the MetaTrader 4 platform. Volume analysis plays an important role in understanding the behavior of major market participants and identifying potential trend reversals or continuations.
Unlike the default volume tool in MT4, this indicator displays colored volume bars along with two moving averages based on volume, making it much easier to evaluate the strength behind price movements.
What is the All Volume Average Indicator?
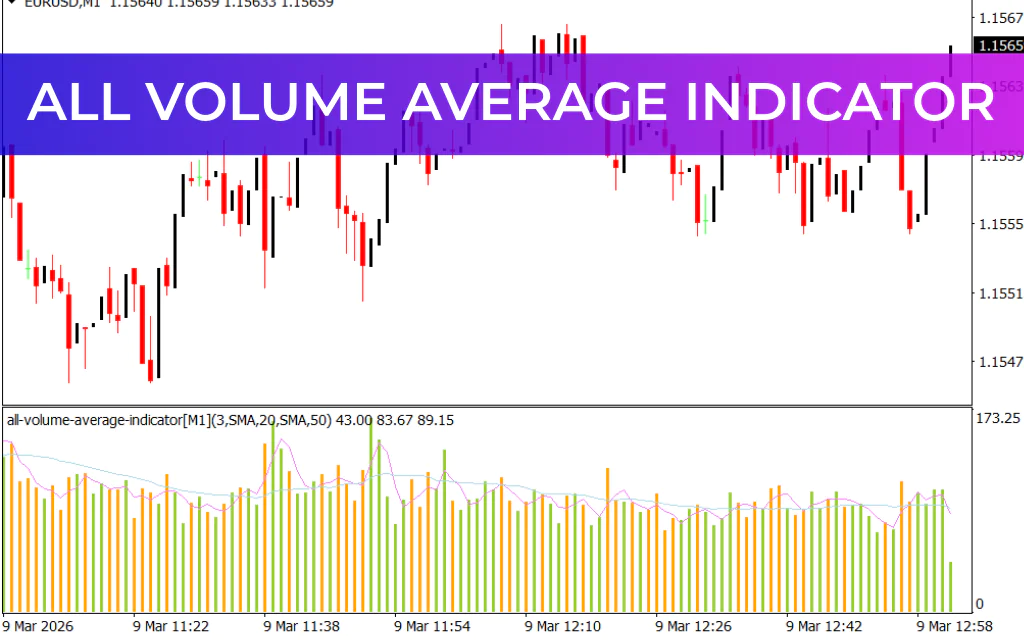
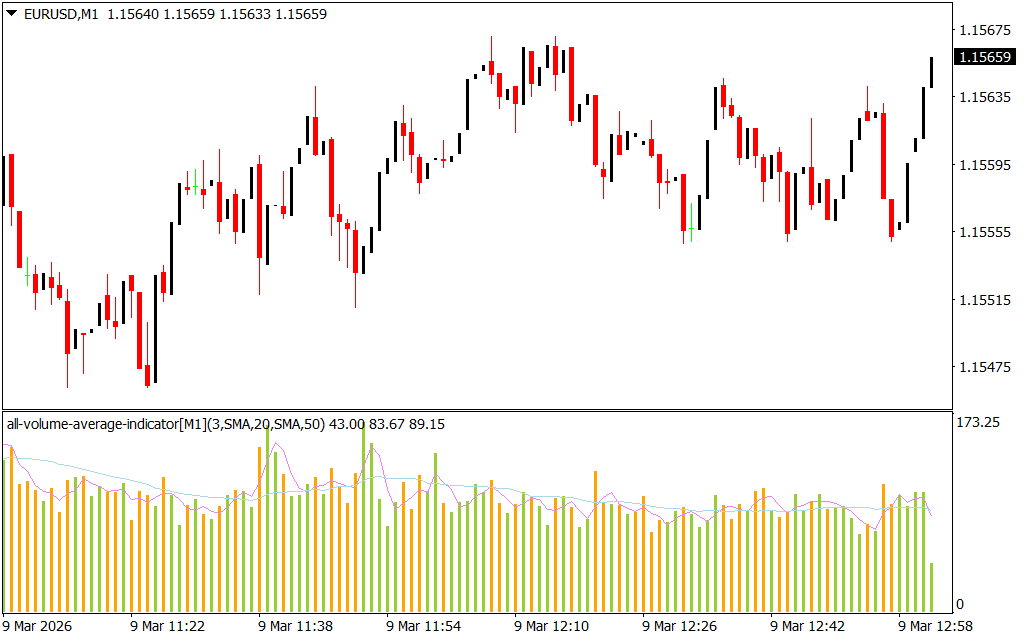
The All Volume Average Indicator adds a volume histogram and two moving averages (MA Volume) to the chart. These moving averages are calculated using volume data instead of price, helping traders better interpret changes in market activity.
The indicator uses different colored histogram bars to quickly visualize the relationship between price movement and volume strength.
Histogram Color Meanings
- Light Green Bars – Price is rising and the fast volume MA is below the slow volume MA.
- Bright Green Bars – Price is rising and the fast volume MA is above the slow volume MA, showing stronger bullish activity.
- Yellow Bars – Price is falling and the fast volume MA is below the slow volume MA.
- Bright Red Bars – Price is falling and the fast volume MA is above the slow volume MA, indicating strong bearish pressure.
This visual system allows traders to quickly identify momentum shifts and volume strength without complex analysis.
What is the MA Volume Indicator?
The MA Volume indicator works similarly to a traditional moving average but is calculated using volume values instead of price data.
This approach helps traders determine whether trading activity is increasing or decreasing, which often reveals the intentions of large market participants such as institutions and professional traders.
Why Use the All Volume Average Indicator?
In standard MetaTrader 4, adding a moving average directly to the volume indicator is not possible using built-in tools. The classic MT4 volume panel only shows raw volume data without averages.
The All Volume Average Indicator solves this problem by automatically including two volume-based moving averages, making volume analysis much easier and more efficient.
How to Use the Indicator in Trading
This indicator does not generate automatic buy or sell signals. Instead, it serves as a support tool for traders who rely on volume analysis.
Volume analysis is a major branch of technical analysis that focuses on how large market participants influence price movements through significant trading volume.
To fully understand volume analysis, many traders study the work of experts such as Tom Williams, Anna Coulling, David Weis, and James Dalton. The foundations of this method were originally developed by legendary trader Richard Wyckoff.
Buy Signal Example
Consider a USDJPY M30 chart where volume analysis suggests a potential long opportunity.
Two bearish candles appear with narrowing bodies while volume remains high. This situation may indicate that large institutional traders are accumulating long positions while prices are temporarily falling.
As selling pressure weakens, the market often begins to slow down and eventually reverse upward.
Such behavior suggests that major players may be preparing for a bullish move, making a long trade a reasonable strategy.
Sell Signal Example
Now consider a GBPUSD H1 chart.
- Bar 1: Price rises sharply with high volume, suggesting strong demand.
- Bar 2: Price growth slows significantly despite even higher volume.
This scenario can indicate that large sellers are entering the market, absorbing the buying pressure.
Traders can mark a supply zone using the high and close of the second candle and wait for the price to return to this level. If the market rejects the zone, it may provide an opportunity to trade a bearish reversal or a false breakout.
Advantages of the Indicator
- Non-repainting indicator
- Displays volume histogram with dual moving averages
- Simple and user-friendly settings
- Suitable for intraday and long-term trading
- Works across multiple markets, including forex, stocks, and indices
Disadvantages of the Indicator
- Does not generate automatic buy or sell signals
- Requires knowledge of volume analysis and Market Structure
- Traders must invest time in learning Supply And Demand concepts
Conclusion
The All Volume Average Indicator for MT4 makes volume analysis more accessible by combining colored volume bars and moving averages in one tool. While it does not provide direct trade signals, it offers valuable insight into market activity and institutional behavior.
For traders who understand volume analysis and supply-demand dynamics, this indicator can become a powerful addition to their trading strategy.
FAQ
Published:
Mar 09, 2026 08:04 AM
Category: