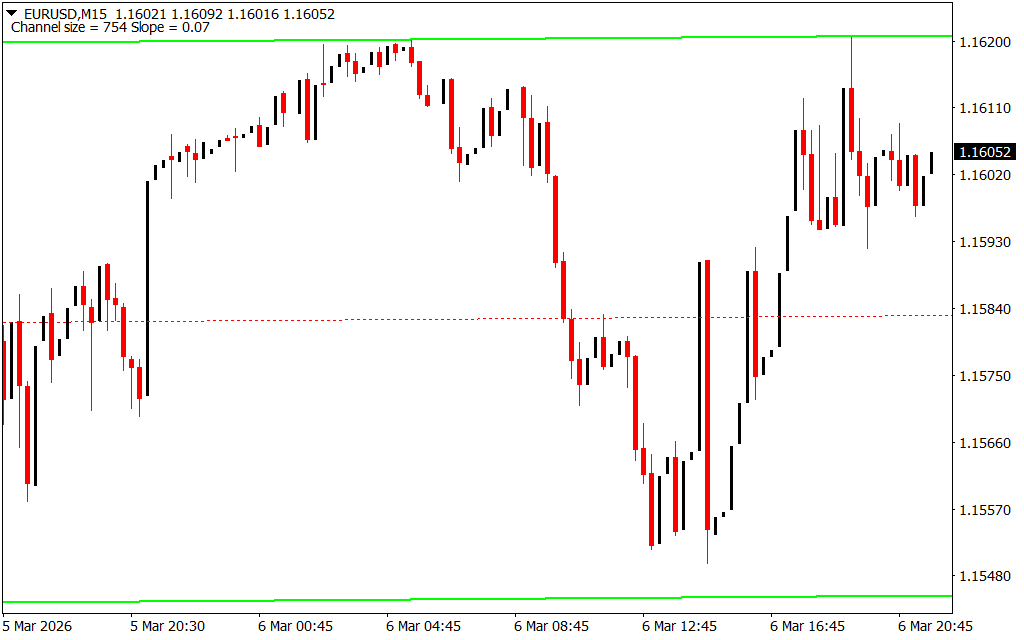
The AFI Channel Surfer V2 Indicator for MetaTrader 4 (MT4) is an automatic trend channel detection tool that draws equidistant trend lines directly on the price chart. These channels help traders identify trend direction, potential reversal zones, and breakout opportunities with minimal manual analysis.
The indicator automatically plots upper and lower channel boundaries, which act as dynamic resistance and support levels, while the centerline functions as a trend divider. This allows traders to quickly determine whether the market is likely to continue in a bullish or bearish direction.
Because of its simplicity and clear visual structure, the AFI Channel Surfer V2 indicator is useful for both beginner and experienced forex traders.
Key Features of the AFI Channel Surfer V2 Indicator
The AFI Channel Surfer V2 offers several helpful features that make trend analysis easier:
- Automatically detects and draws trend channels
- Displays upper and lower support/resistance levels
- Includes a midline to identify trend continuation
- Helps locate Trend Reversal and breakout zones
- Works across multiple timeframes
These features make the indicator ideal for traders who want a clear visual representation of market trends without manually drawing channels.
Understanding the Indicator Structure
The AFI Channel Surfer V2 indicator consists of three main parts:
Upper Channel Line
Acts as a dynamic resistance level, where price may face selling pressure or potential reversal.
Lower Channel Line
Functions as dynamic support, where price may bounce and continue in the direction of the trend.
Centerline (Midline)
Serves as a trend divider, helping traders determine whether the market momentum favors buyers or sellers.
How to Trade With the AFI Channel Surfer V2 Indicator
Traders can use this indicator for both trend reversal trading and breakout strategies.
Trend Reversal Strategy
When price approaches the upper or lower boundary of the channel, a reversal may occur.
Example scenario:
- The indicator identifies a bullish trend channel on a chart such as AUD/USD on the H4 timeframe.
- Price reaches the upper channel boundary.
- A Doji candlestick forms, signaling market indecision.
- A bearish confirmation candle appears afterward.
- Traders may enter a sell trade, anticipating a bearish reversal.
Combining the channel signal with Price Action patterns increases the reliability of the trade.
Breakout Trading Strategy
The AFI Channel Surfer V2 indicator is also useful for identifying trend breakouts.
Typical breakout setup:
- Price breaks above the upper channel line during an uptrend.
- The market retests the broken channel boundary.
- Price resumes movement in the breakout direction.
- Traders may open a buy position after confirmation.
This breakout-and-retest approach is a common strategy used to confirm strong market momentum.
Best Trading Styles for This Indicator
The AFI Channel Surfer V2 indicator works effectively for different trading styles, including:
- Scalping
- Intraday trading
- Day trading
- Swing trading
It can also be applied to multiple timeframes such as M15, H1, H4, and Daily charts.
Conclusion
The AFI Channel Surfer V2 Indicator for MT4 is a powerful trend-following and channel analysis tool that automatically identifies market channels on the chart. By highlighting Support And Resistance levels within a trend channel, it helps traders spot potential reversal points and breakout opportunities.
Its automated channel detection makes it especially useful for traders who want to simplify chart analysis while improving trend identification. Best of all, the indicator is free to download and easy to install on MetaTrader 4.
FAQ
Published:
Mar 07, 2026 16:09 PM
Category: