Free
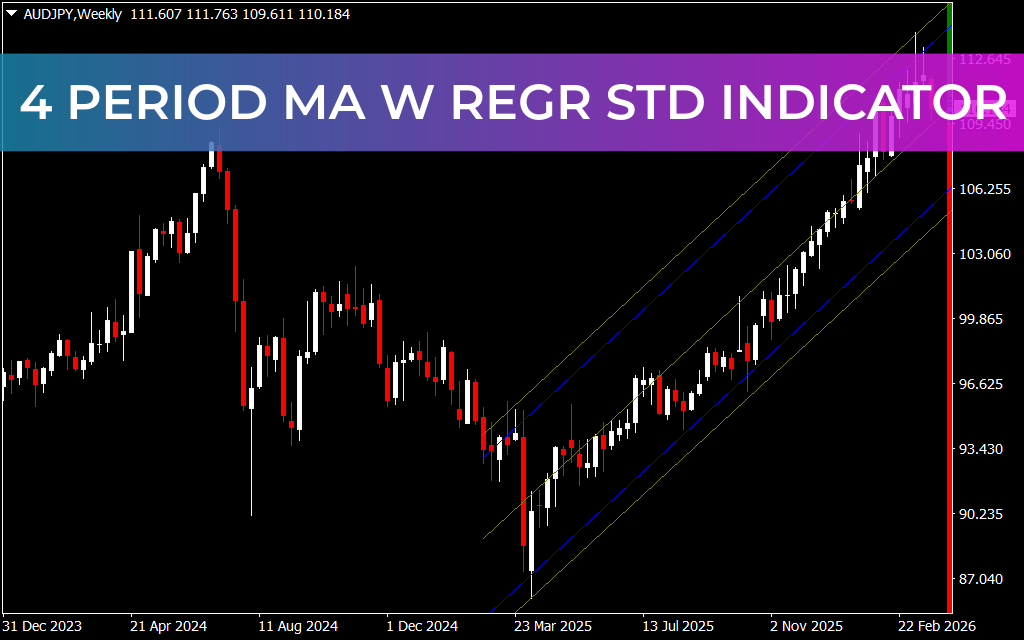
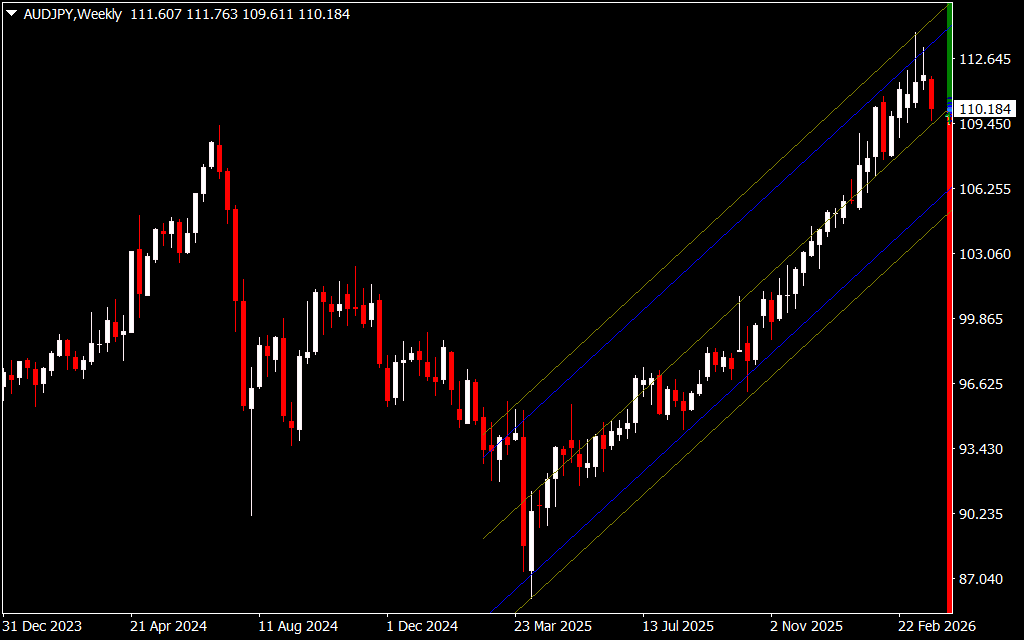
The 4 Period MA W Regr Std Indicator for MT4 is a powerful tool that automatically plots Support And Resistance levels, a regression channel, and a standard deviation channel. By combining these features, forex traders can quickly identify trend direction, optimal entry points, and exit targets across multiple timeframes.
Key Features of the 4 Period MA W Regr Std Indicator
- Regression Channel: Plotted in blue, it helps identify the overall trend slope and direction.
- Standard Deviation Channel: Plotted in olive, it measures volatility and potential price swings.
- Support & Resistance Levels: Red and green rectangles show key levels at 5, 15, 60, and 240-minute intervals, with potential support and resistance values in blue.
- Multi-Timeframe Compatibility: Works on intraday, daily, weekly, and monthly charts, suitable for scalpers, intraday, and long-term traders.
How to Trade Using the Indicator
- Trend Direction:
- Uptrend: Enter a buy trade near the lower end of the channel, with a stop loss below the previous swing low. Target profits at the upper channel boundary.
- Downtrend: Enter a sell trade near the upper end of the channel, with a stop loss above the recent swing high. Book profits near the lower channel boundary.
- Channel Analysis: The slope of the regression channel indicates the market trend, while the standard deviation channel highlights volatility for better risk management.
Benefits of the 4 Period MA W Regr Std Indicator
- Automatically identifies support and resistance levels.
- Provides clear visualization of trend and volatility.
- Works for both new and advanced traders.
- Effective for multi-timeframe strategies, from Scalping to long-term trading.
Conclusion
The 4 Period MA W Regr Std Indicator for MT4 simplifies trend analysis and trade planning by combining regression, volatility, and support/resistance levels. It is an essential tool for forex traders seeking precise entries, stop-loss placements, and profit targets across multiple timeframes.
FAQ
A blue linear regression channel anchors trend, an olive standard deviation envelope shows typical dispersion, and red/green markers align with common intraday reference periods (such as 5/15/60/240-minute framing) so multi-horizon traders see mean, variance, and time cues together.
Buy support near the lower regression rail when candles confirm, hide stops under the latest swing, and target the opposing band or partial profits into the olive zone—width tells you how violent a “normal” excursion should be.
Fade or sell rallies into the upper regression boundary in bearish contexts with stops beyond the structural high and managerial targets toward lower rails.
Wider separation implies the market expects larger excursions from the regression mean—scale position and stop width accordingly instead of using quiet-day assumptions.
Scalpers through monthly-position planners can attach it; just slow down signal interpretation on large charts where each bar represents more time.
1 Download
Published:
Mar 28, 2026 21:47 PM
Category:
Share: