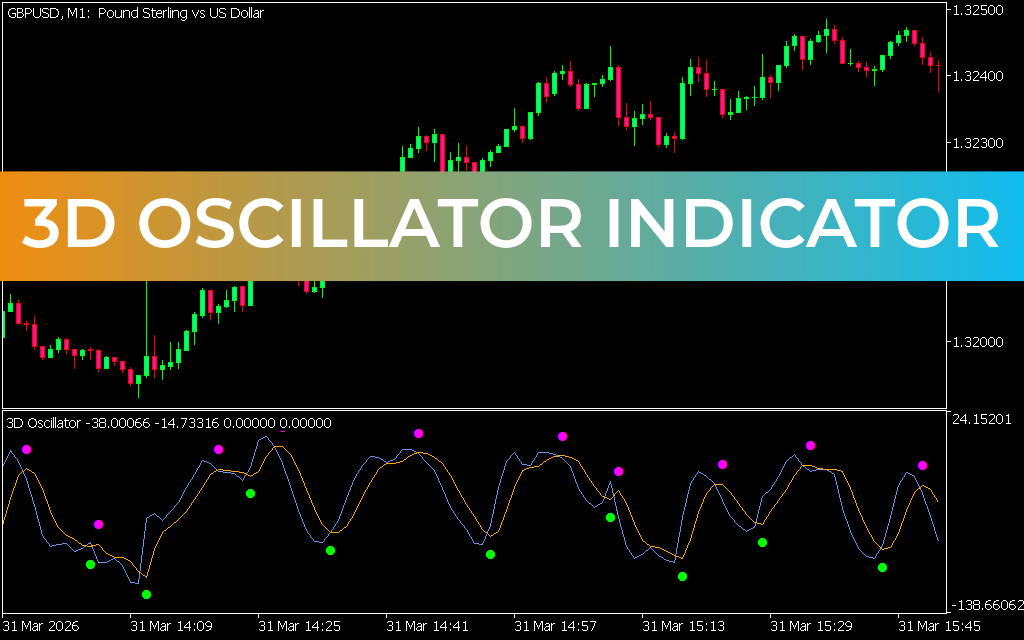
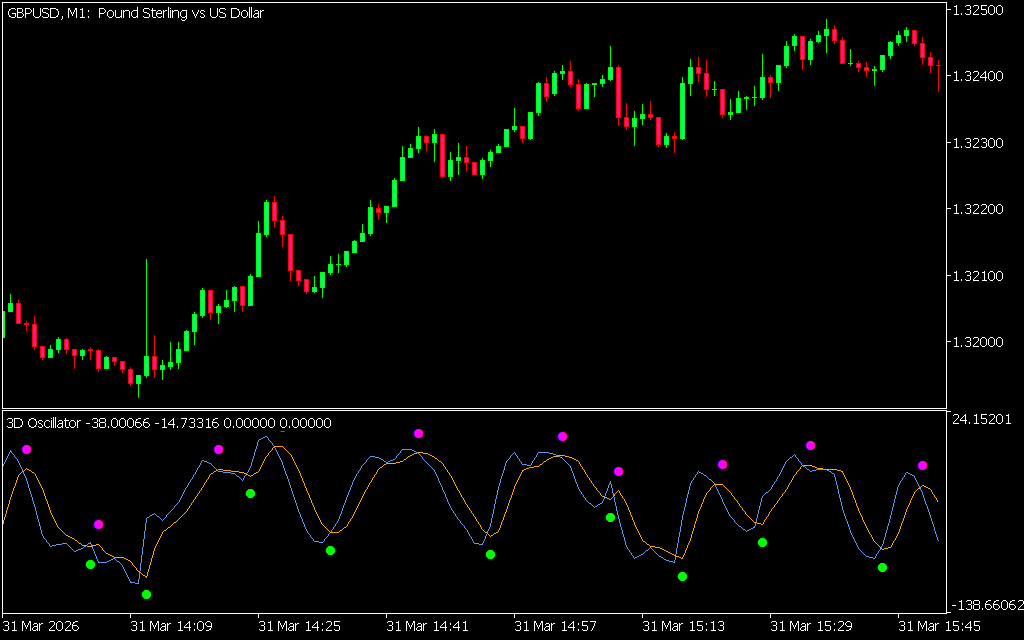
The 3D Oscillator Indicator for MT5 is an advanced version of the traditional stochastic oscillator. It consists of two lines — %K and %D — where %K represents the current market position and %D is a moving average of %K. Together, they generate signals that help traders identify potential entry and exit points. Like the standard stochastic, the 3D Oscillator works across all timeframes, though longer timeframes provide more reliable signals by reducing market noise.
How the 3D Oscillator Works
- %K Line: Reflects the current market position.
- %D Line: A moving average of %K, used to smooth signals.
- Overbought Zone (Above 80): Suggests the asset may be overbought, signaling potential short opportunities.
- Oversold Zone (Below 20): Suggests the asset may be oversold, signaling potential long opportunities.
- Divergence Detection: If price makes higher highs while the oscillator makes lower highs, it indicates bearish divergence and possible reversal.
How to Trade with the 3D Oscillator in MT5
- Identify Overbought Levels – When the oscillator rises above 80, prepare for potential bearish reversals.
- Spot Oversold Levels – When the oscillator falls below 20, anticipate bullish reversals.
- Look for Divergence – Use discrepancies between price and oscillator movement to predict reversals.
- Confirm with Other Tools – Combine with RSI, MACD, or Price Action for stronger confirmation.
- Use Longer Timeframes – Apply on H4 or daily charts to reduce false signals.
For example, on the AUD/NZD H4 chart, a reading above 80 may signal overbought conditions, while divergence between price and oscillator can highlight a Trend Reversal.
Benefits
- Advanced version of the stochastic oscillator.
- Provides clear overbought and oversold signals.
- Detects divergence for early reversal identification.
- Works across all timeframes and trading styles.
Conclusion
The 3D Oscillator Indicator for MT5 enhances the traditional stochastic by providing smoother and more reliable signals. By identifying overbought/oversold levels and divergences, traders can anticipate reversals and refine their entries. For best results, use it alongside other technical indicators to confirm signals. The indicator is free to download and easy to install.
8 Downloads
Published:
Apr 08, 2026 01:56 AM
Category: