The TSV Bullish Bearish indicator for MT4 is a powerful tool for forex traders, providing clear trading signals by comparing averages over a given period. Using a simple colored histogram, this indicator helps traders identify and follow current market trends effectively.
Key Features
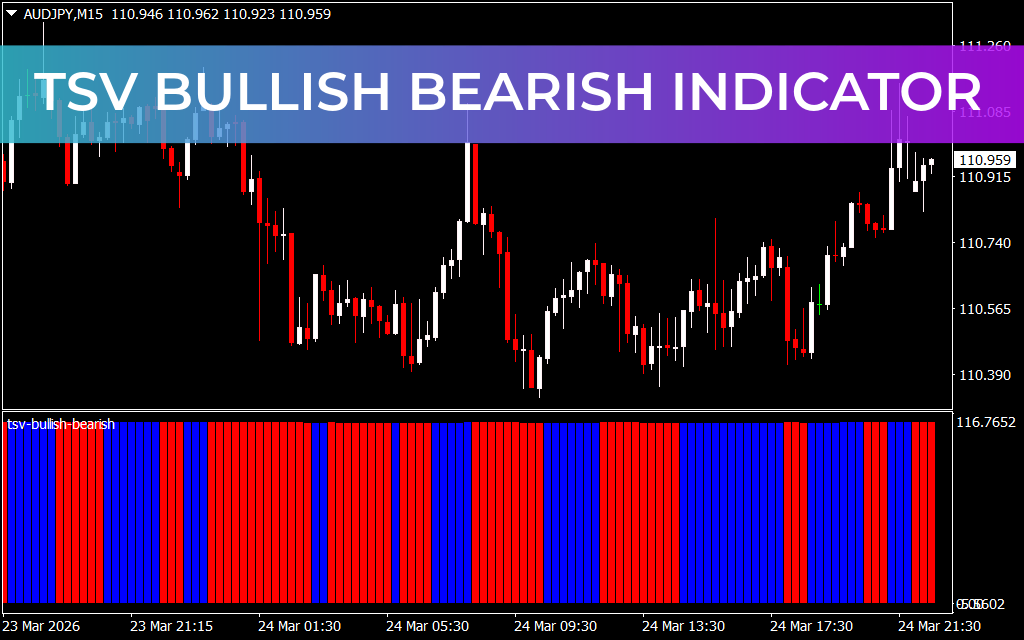
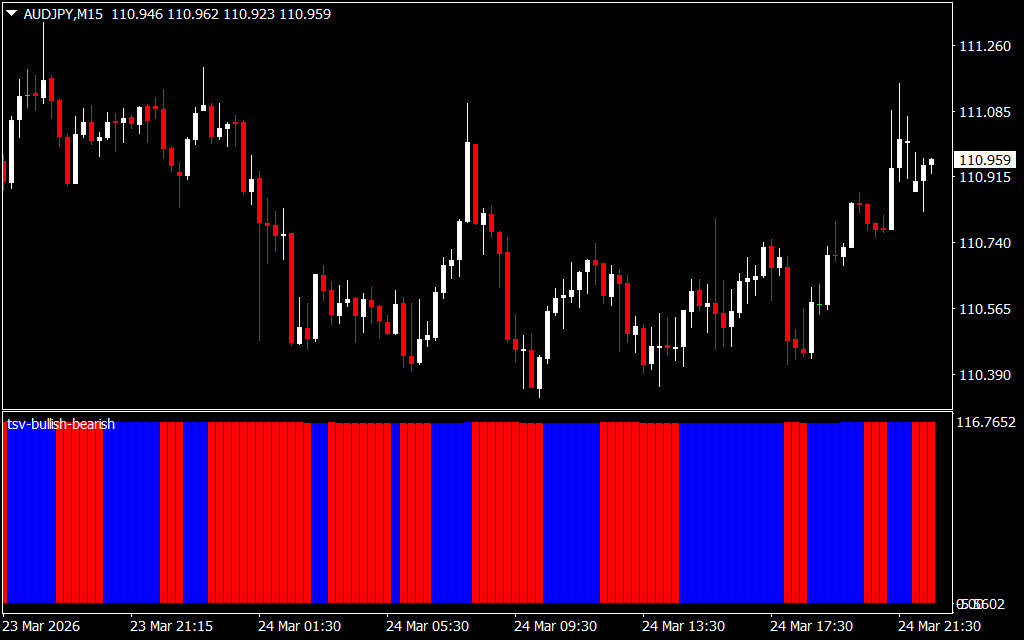
- Color-Coded Histogram: Blue bars indicate bullish trends, while red bars indicate bearish trends.
- Easy to Use: Suitable for both beginner and advanced forex traders.
- Multi-Timeframe Compatibility: Works on intraday, daily, weekly, and monthly charts.
- Automation-Friendly: Can be integrated into automated trading strategies for trend detection.
How It Works
The indicator displays a histogram in a separate window:
- Blue Bars: Signal bullish momentum; consider entering buy trades with a stop loss below the previous swing low.
- Red Bars: Signal bearish momentum; consider entering sell trades with a stop loss above the previous swing high.
Traders can also use higher timeframe trends to guide entries in lower timeframes, supporting a multi-timeframe (MTF) trading strategy that helps maintain alignment with the dominant market trend, potentially increasing win ratios.
Why Use TSV Bullish Bearish Indicator
This MT4 indicator is ideal for trend traders who want a visual and straightforward tool for market analysis. It also serves as a valuable filter when used in combination with other technical indicators to refine trade entries.
Conclusion: The TSV Bullish Bearish indicator for MT4 is an essential tool for forex traders, providing reliable trend signals and helping traders stay aligned with market movements.
FAQ
3 Downloads
Published:
Mar 24, 2026 17:54 PM
Category: