Free
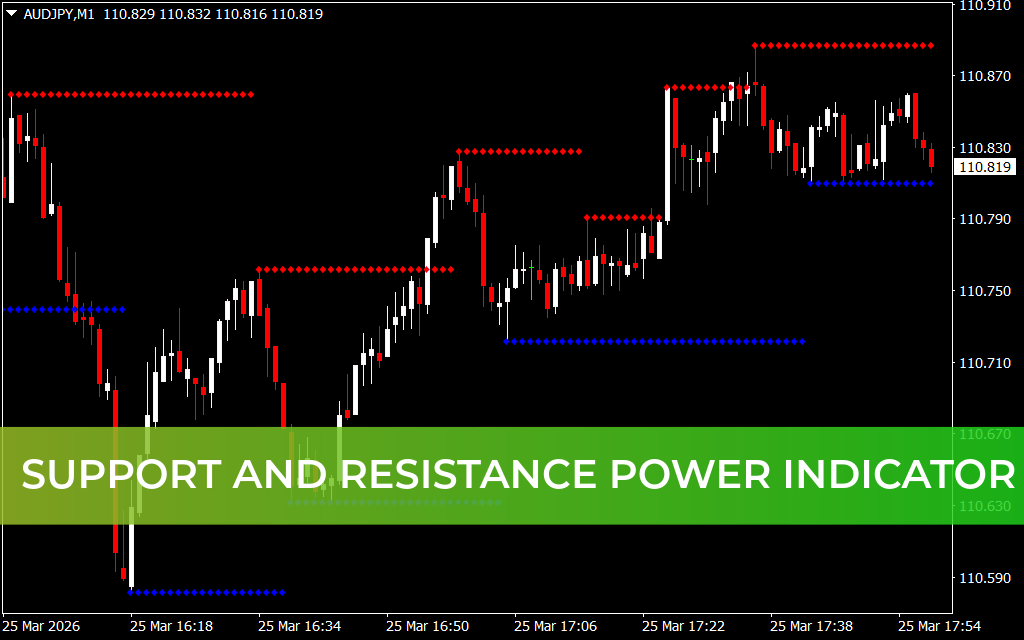
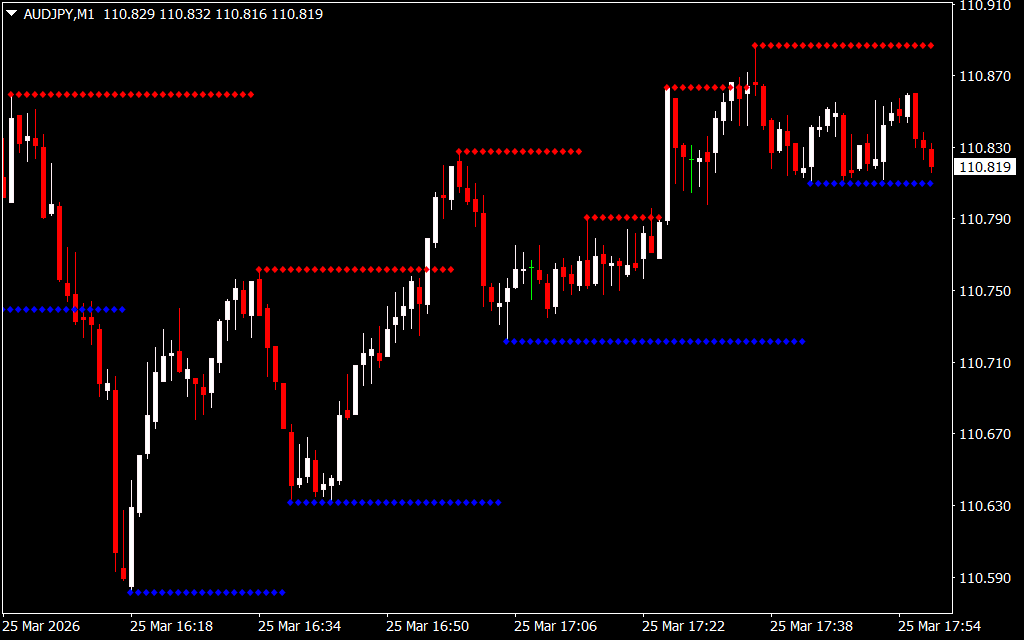
The Support And Resistance Power indicator for MetaTrader 4 (MT4) is a price-based trading tool that identifies key support and resistance levels using the highest high and lowest low over a chosen period. It does not rely on complex calculations or formulas, making it a straightforward and reliable indicator for forex traders.
How the Indicator Works
- High and Low Identification:
- Finds the highest high in the input period and marks it as resistance
- Finds the lowest low in the input period and marks it as support
- Visual Representation:
- Resistance lines are red dotted lines
- Support lines are blue dotted lines
- Timeframe Flexibility:
- Works on intraday, daily, weekly, and monthly charts
- Suitable for Scalping, intraday, swing, and long-term trading
How to Trade Using Support and Resistance Power
- Buy Trades:
- Enter a buy trade above the support line
- Place a stop loss just below the support
- Consider booking profits at the next resistance level or upon an opposite trading signal
- Sell Trades:
- Enter a sell trade below the resistance line
- Place a stop loss above the resistance
- Book profits at the next support level or upon an opposite trading signal
Benefits of the Indicator
- Eliminates discretion: Automatically identifies support and resistance levels for traders
- Simple to use: Ideal for both beginners and advanced traders
- Works on all timeframes: Effective for short-term and long-term trading strategies
- Supports price-based trading: No reliance on moving averages or other lagging indicators
Conclusion
The Support and Resistance Power indicator for MT4 provides a clear, automated way to identify key levels in the market. By using the highest high and lowest low of a selected period, it helps traders make objective trading decisions and reduces errors from subjective level identification.
FAQ
It takes the highest high and lowest low across your chosen lookback and renders red dotted resistance and blue dotted support—no exotic maths, just period extremes.
Execute longs on supportive holds above the blue line with stops just beneath; sells fade under red with stops overhead.
Wide windows paint slower levels; tight windows hug price—tune lookback to the holds you actually take.
It removes discretionary eyeball levels for traders who want repeatable horizontal discipline.
Oscillators or volume at the levels improve timing so taps become scenarios, not coin flips.
6 Downloads
Published:
Mar 25, 2026 13:00 PM
Category:
Share: