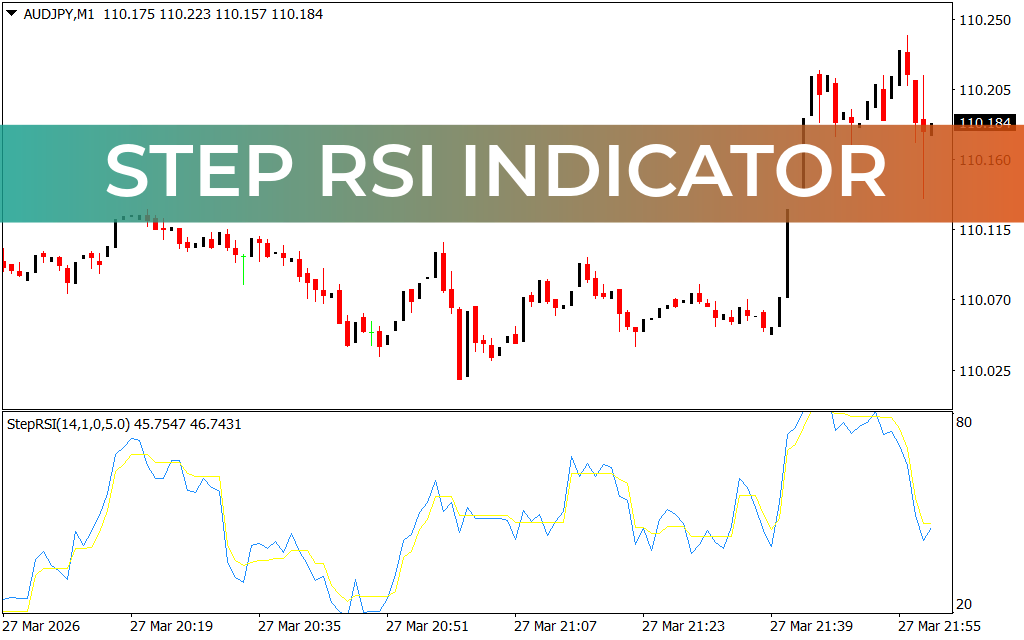
The Step RSI Indicator for MT4 enhances the classic RSI by adding a step filter and a moving average, reducing false signals and improving trade accuracy. This makes it a reliable tool for both beginner and advanced forex traders. By combining these filters, traders can focus on high-probability entries while avoiding common pitfalls of the standard RSI.
Key Features of the Step RSI Indicator
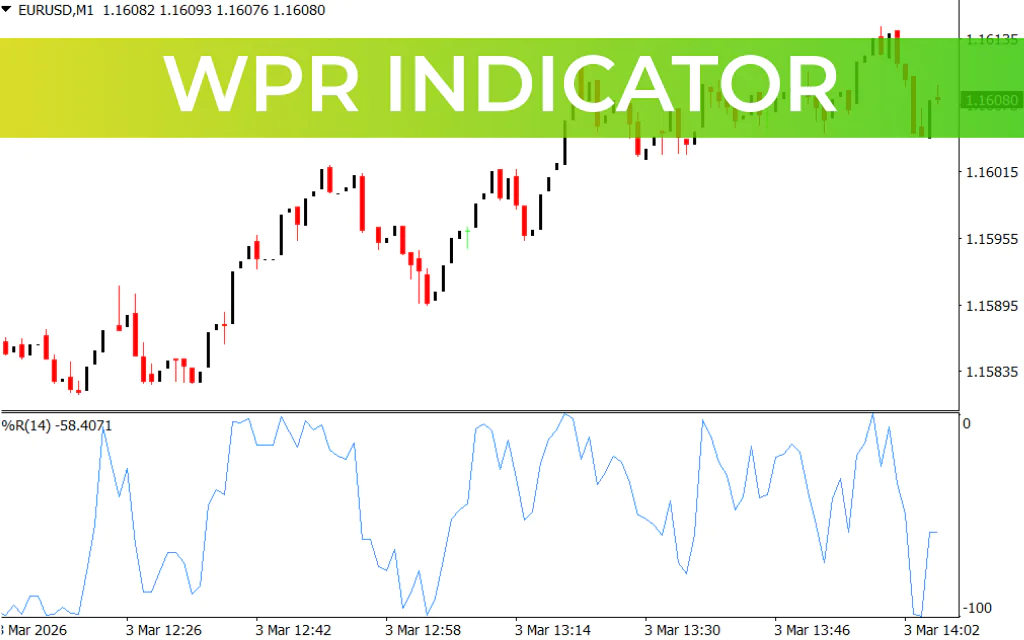
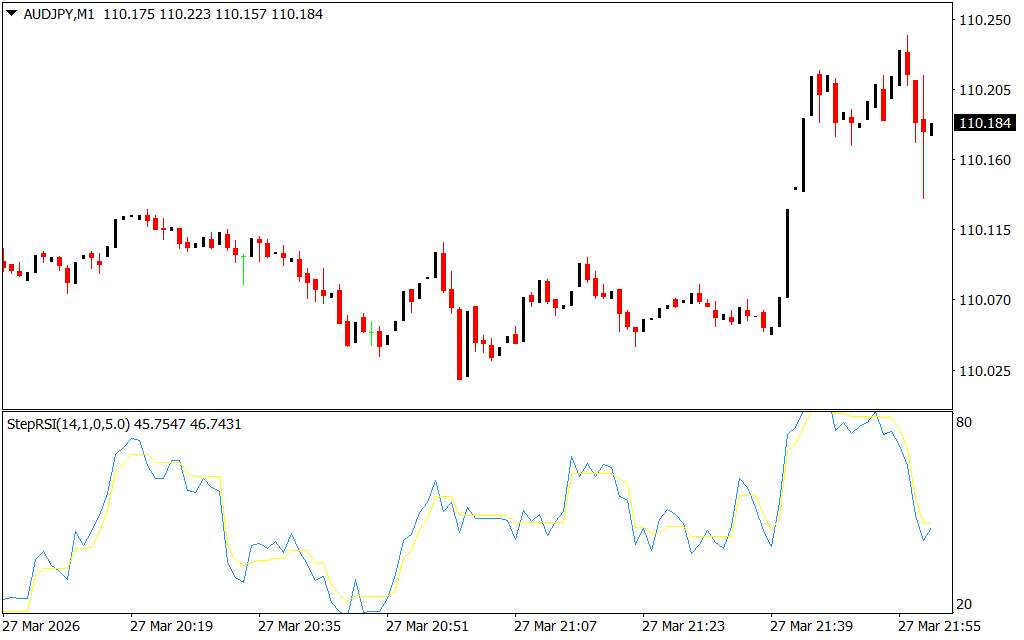
- Simple Visuals: Plots a blue RSI line and a yellow moving average signal line for easy interpretation.
- Versatile Timeframes: Suitable for all intraday and long-term charts.
- Filtered Signals: Eliminates most false starts, providing cleaner and more actionable trading cues.
How to Trade with Step RSI
The trading strategy relies on crossovers of the RSI and moving average lines after reaching overbought or oversold levels:
- Buy Signal: When the RSI falls below the oversold level (commonly 30) and then crosses back above the threshold, enter a buy trade. Place a stop loss below the previous swing low and exit near the overbought level.
- Sell Signal: When the RSI rises above the overbought level (commonly 70) and then reverses below it, enter a sell trade.
Traders can customize overbought and oversold levels to fit their trading style, making the Step RSI indicator highly flexible.
Why Traders Use Step RSI
The Step RSI Indicator simplifies the decision-making process while maintaining the strengths of the classic RSI. Its step and moving average filters provide high-quality trading signals, making it a valuable addition to any technical analysis toolkit.
Conclusion
In summary, the Step RSI Indicator for MT4 is an effective tool for filtering RSI signals. It helps forex traders avoid false starts and identify profitable entry points, improving overall trading performance.
FAQ
Published:
Mar 27, 2026 19:02 PM
Category: