The Price Border Indicator for MetaTrader 4 (MT4) is a powerful technical tool that combines the Average True Range and the Half Length indicator to generate high-probability forex trading signals. By identifying extreme market conditions, this indicator helps traders spot potential reversal points with improved accuracy.
It is suitable for both beginners and advanced traders and works effectively across all timeframes, from intraday charts to weekly and monthly analysis.
Key Features of the Price Border Indicator
- Combines ATR and Half Length for precise signal generation
- Identifies overextended price movements
- Works on all timeframes (M1 to Monthly)
- Suitable for manual and automated trading strategies
- Helps detect reversal opportunities at extreme levels
- Easy-to-read visual signals
How the Indicator Works
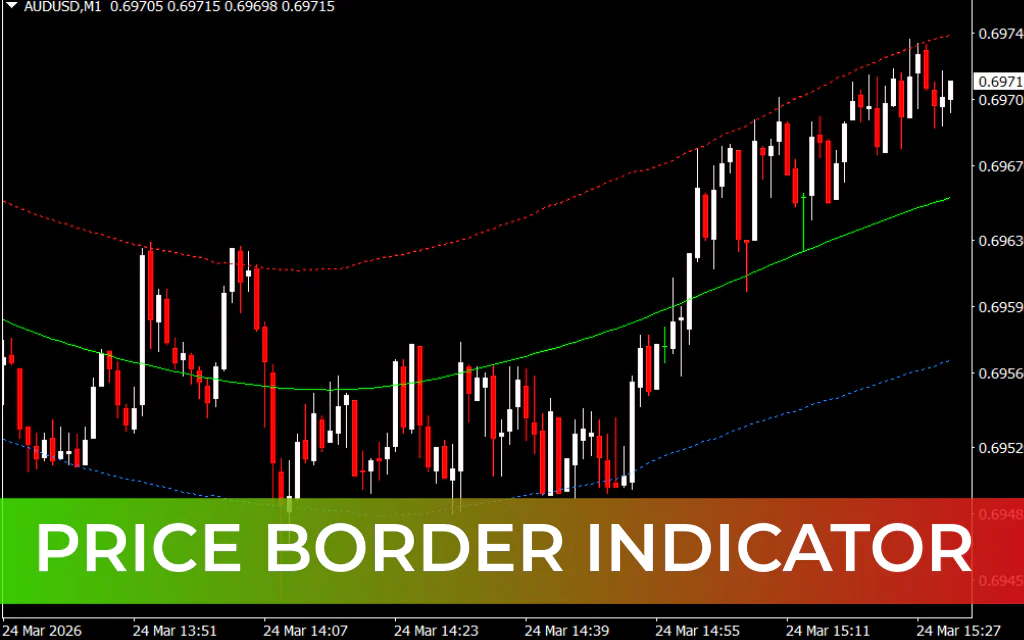
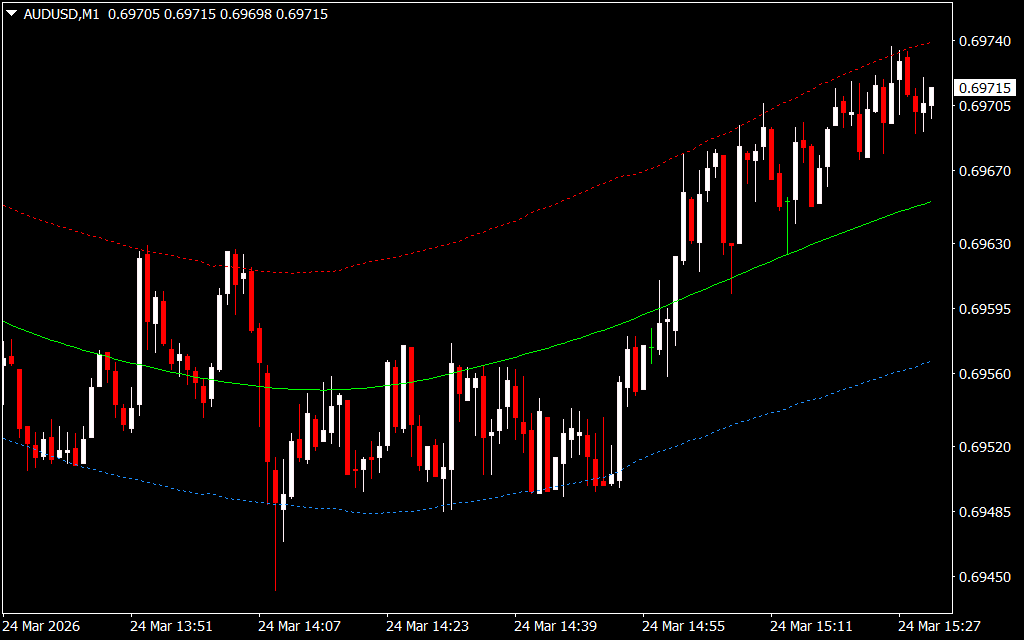
The indicator plots three key components on the chart:
- Green line: Half Length trend line
- Red dots: Upper ATR band
- Blue dots: Lower ATR band
These bands represent extreme price levels where reversals are more likely to occur.
Trading Strategy
The best approach is to trade reversals when price moves outside the outer bands and then returns within them.
Sell Setup
- Price moves above the upper ATR band (red dots)
- Price reverses back inside the band
- Enter a sell trade
- Place stop loss above the previous swing high
- Take profit near the lower band
Buy Setup
- Price moves below the lower ATR band (blue dots)
- Price reverses back inside the band
- Enter a buy trade
- Place stop loss below the previous swing low
- Take profit near the upper band
Important Trading Insight
This indicator performs best in range-bound or moderately trending markets. In strong trends, price may continue moving beyond the bands without reversing, which can lead to false signals.
Additionally, the indicator recalculates based on price changes, so traders should:
- Wait for candle confirmation before entering trades
- Use additional indicators for confirmation
- Test the strategy on a demo account before live trading
Why Use the Price Border Indicator?
- Identifies high-probability reversal zones
- Combines volatility and trend analysis
- Helps improve entry and exit timing
- Works well with other technical indicators
Conclusion
The Price Border Indicator for MT4 is an effective tool for identifying reversal opportunities using ATR and Half Length analysis. While it can generate profitable signals in the right market conditions, traders should use proper confirmation and risk management. Forward testing is recommended before applying it in live trading environments.
FAQ
1 Download
Published:
Mar 24, 2026 10:32 AM
Category: