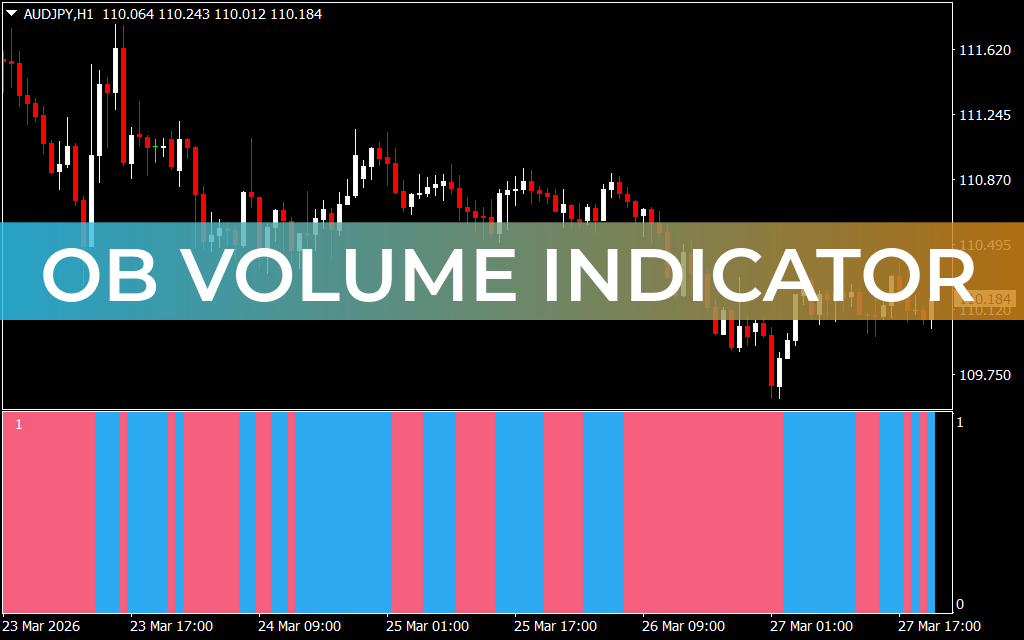
The OB Volume Indicator for MT4 is a volume-based trading tool that plots histogram bars derived from the On Balance Volume (OBV) moving average. By analyzing volume trends alongside price movements, traders can identify bullish or bearish momentum and make informed trading decisions.
Key Features of OB Volume Indicator
- Volume-Based Analysis: Tracks OBV to determine market strength and liquidity.
- Histogram Signals: Blue bars indicate bullish volume; red bars indicate bearish volume.
- Smoothed Output: Uses a moving average to reduce noise and improve signal clarity.
- All-Timeframe Compatibility: Works well on intraday charts and higher timeframes; less effective for very low timeframes.
How to Trade with OB Volume
The OB Volume Indicator helps traders anticipate market movements based on volume trends:
- Buy Signal: When histogram bars turn blue, anticipate bullish momentum and consider entering a buy trade.
- Sell Signal: When histogram bars turn red, anticipate bearish momentum and consider entering a sell trade.
- Trade Confirmation: Use support/resistance levels, Price Action, or additional indicators to validate trades.
- Risk Management: No built-in stop loss or take profit; use swing highs/lows or risk/reward ratios to manage positions.
Volume typically precedes price, so monitoring OBV movements can give traders an early indication of potential trend changes.
Why Traders Use OB Volume
The OB Volume Indicator is ideal for intraday traders seeking volume-based insights into the market. It helps identify strong momentum moves, confirm trends, and improve timing for trade entries and exits.
Conclusion
In summary, the OB Volume Indicator for MT4 is a reliable tool for forex traders who rely on volume analysis. By combining volume trends with other technical indicators, traders can make more informed decisions and enhance their trading strategies.
FAQ
1 Download
Published:
Mar 27, 2026 19:44 PM
Category: