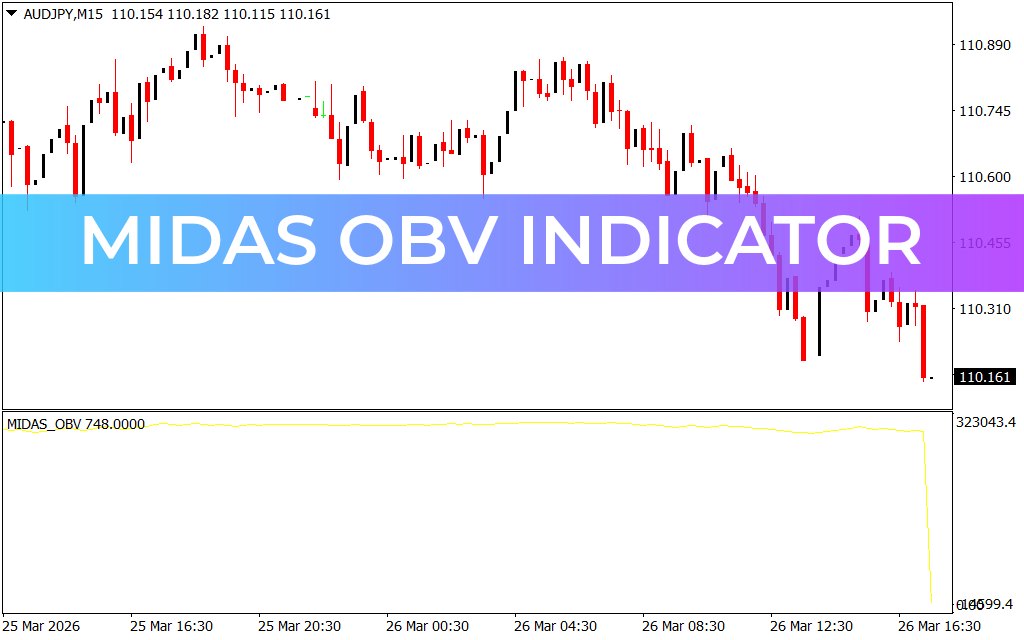
The Midas OBV Indicator for MT4 is a powerful volume-based tool built on the principle that volume precedes price. Using the On Balance Volume (OBV) concept, it measures the difference in volume between consecutive candlesticks and plots it as an oscillator line. This allows traders to anticipate potential price movements based on changes in market participation.
Since price often follows volume, this indicator helps traders identify bullish or bearish momentum early and act before major price moves occur. Its simple design makes it suitable for both beginner and advanced traders.
Midas OBV Indicator Trading Signals
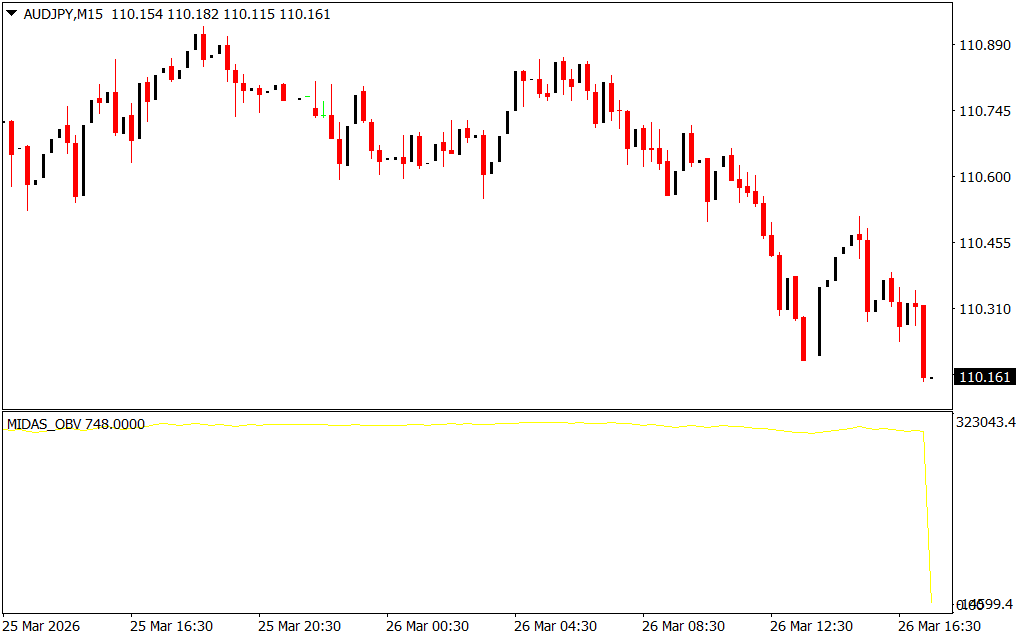
The indicator displays a yellow oscillator line in a separate window:
- Rising Line: Indicates increasing buying pressure and a potential bullish trend.
- Falling Line: Signals growing selling pressure and a potential bearish trend.
Trading Strategy:
- Trendline Breakouts:
- Draw trendlines on both the price chart and the OBV indicator.
- A breakout in the OBV line often precedes a breakout in price.
- Buy Signal:
- Enter when the OBV breaks a bullish trendline.
- Place a stop-loss below the previous swing low.
- Sell Signal:
- Enter when the OBV breaks a bearish trendline.
- Place a stop-loss above the previous swing high.
- Exit Strategy:
- Look for weakening momentum or corrections in the OBV line to secure profits.
This approach helps traders anticipate breakouts and confirm Trend Strength using volume analysis.
Why Use the Midas OBV Indicator?
- Leverages volume to predict future price movements
- Identifies trend strength and potential reversals
- Helps confirm breakout signals before price reacts
- Works across all timeframes and trading styles
By combining volume analysis with trendline techniques, the Midas OBV Indicator for MT4 gives traders a strategic edge in spotting trend changes and breakout opportunities.
Download the Midas OBV Indicator for MT4 today and trade smarter using the power of volume-based analysis!
FAQ
1 Download
Published:
Mar 26, 2026 12:40 PM
Category: