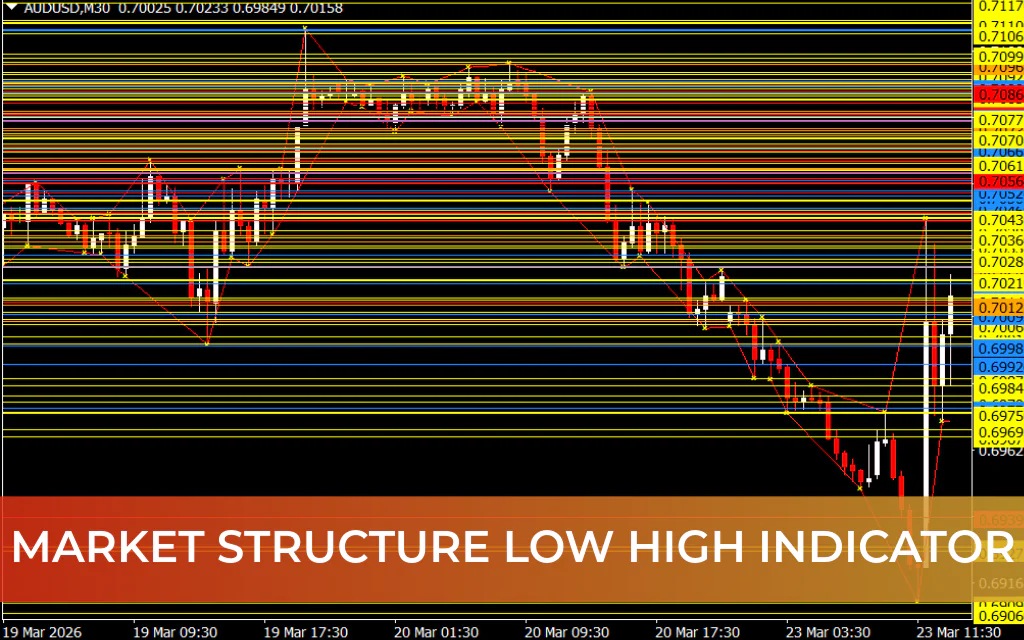
The Market Structure Low High indicator for MetaTrader is a channel-like technical analysis tool that marks swing highs and lows directly on your chart. These swing points serve as potential reversal zones, helping traders identify high-probability buy and sell opportunities.
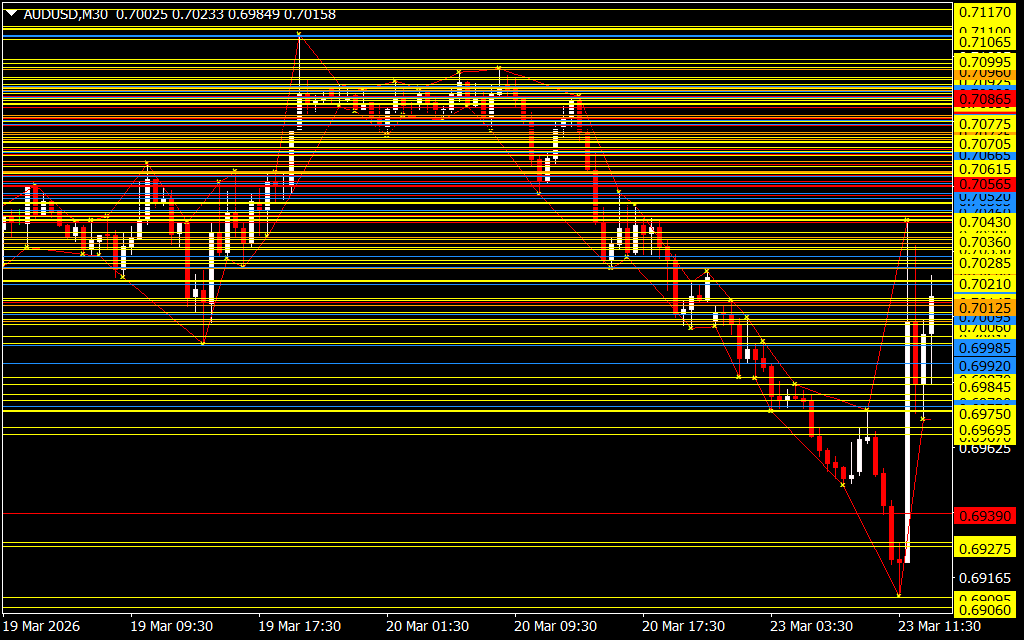
The indicator draws a channel-like structure by connecting consecutive swing points with dots and horizontal bars. These bars act as Support And Resistance levels, which are crucial for planning entries and exits. The more a price reacts to a level, the stronger that support or resistance tends to hold, increasing the probability of a reversal.
This indicator is suitable for novice, intermediate, and advanced traders, and works well for Scalping, day/intraday, and swing trading.
How to Trade With the Market Structure Low High Indicator
The indicator identifies potential high-probability trade setups by highlighting swing highs and lows:
- Sell Signal Example:
- The indicator identifies a swing high and draws a horizontal bar.
- Price rallies to the level, retests it, and reverses downward.
- On the third touch, the resistance level holds strongly, presenting a selling opportunity.
- Buy Signal:
Apply the same logic at swing lows. When price retests the horizontal support drawn at a swing low, it may present a buying opportunity.
✅ Tip: The more times price tests a swing high/low without breaking it, the stronger the potential reversal zone. Combine with other tools like RSI or MACD for higher confirmation.
Advantages of the Market Structure Low High Indicator
- Automatically identifies swing highs and lows
- Draws support and resistance bars for easy analysis
- Highlights high-probability reversal zones
- Suitable for all trading levels
- Works across multiple timeframes and trading styles
- Easy to use, free to download
Conclusion
The Market Structure Low High Indicator for MT4 is a reliable and visual tool for identifying Trend Reversal zones with minimal effort. By marking key swing highs and lows, it helps traders focus on high-probability trade setups and reduces guesswork.
Download the Market Structure Low High Indicator for free and enhance your forex trading strategy today.
FAQ
1 Download
Published:
Mar 23, 2026 08:47 AM
Category: