The I Cross Main Indicator for MT4 is a specialized tool for forex traders that identifies price discrepancies in cross currency pairs, creating arbitrage trading opportunities. By comparing the closing prices of the major currency pairs that form a cross currency, the indicator highlights moments when the cross pair price deviates from the synthetic price derived from its constituent major pairs. This allows traders to capitalize on short-term inefficiencies in the market.
I Cross Main Indicator Trade Setup
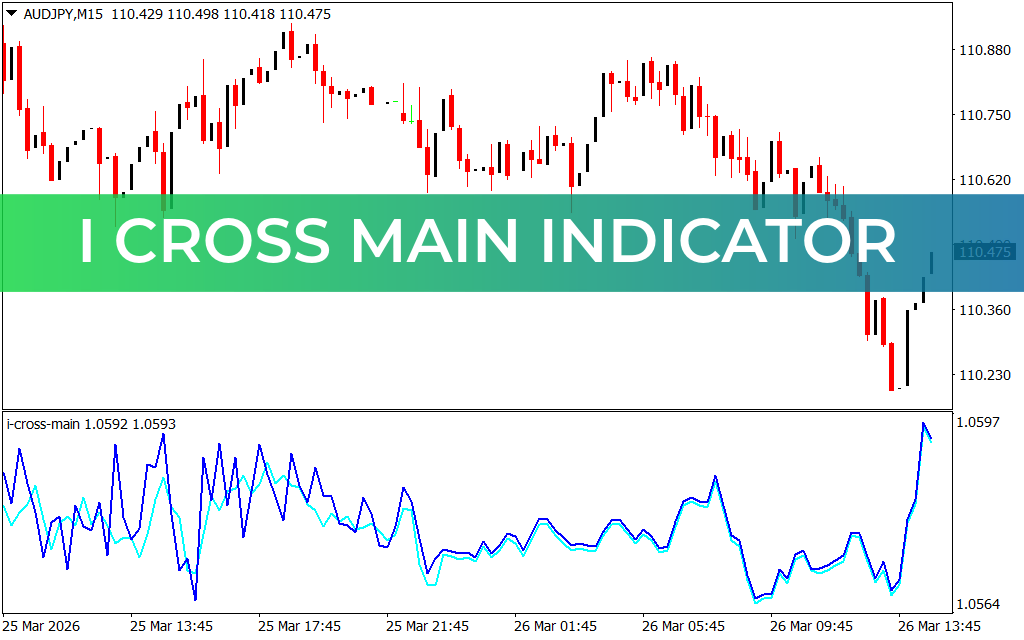
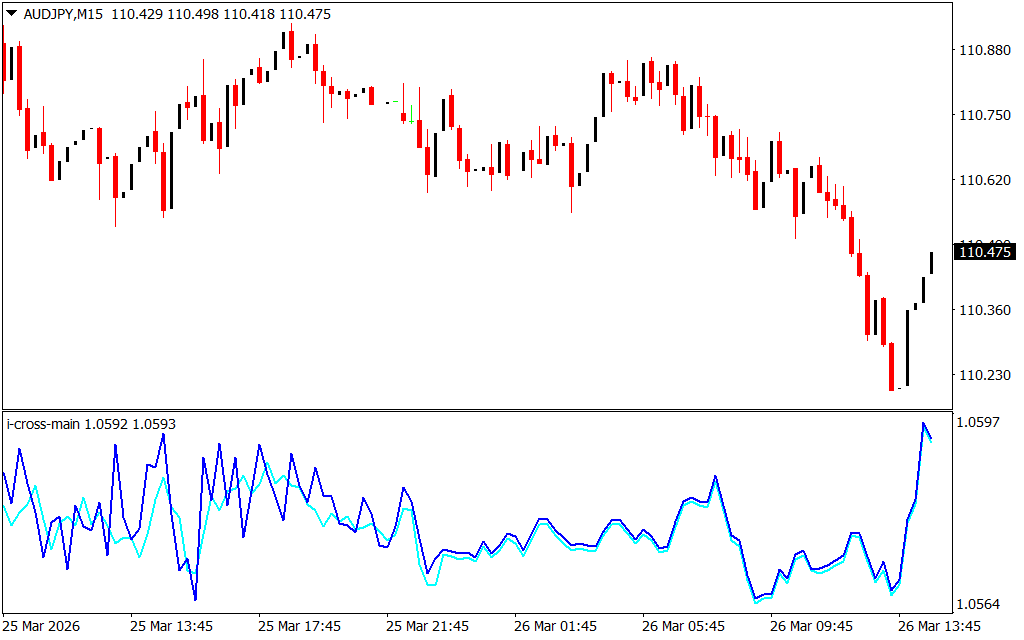
- Indicator Lines:
- Aqua Line: Represents the actual cross currency price.
- Blue Line: Represents the synthetic price calculated from the major pairs.
- Arbitrage Signals:
- When the lines diverge, a price discrepancy occurs, signaling a potential trading opportunity.
- Traders can enter trades to capitalize on the adjustment as the cross and major pair prices realign.
- Customizable Settings:
- Select the cross currency and its major constituent pairs for focused trading.
- Works best on M1 and M5 charts, ideal for Scalping strategies.
This indicator is particularly useful for advanced traders familiar with calculating cross currency prices, though beginners can benefit by learning the price relationships. By leveraging these short-term price inefficiencies, traders can enhance precision and potential profitability.
Benefits of Using the I Cross Main Indicator
- Identifies short-term forex arbitrage opportunities
- Highlights price discrepancies in cross currency pairs
- Supports multiple cross currencies with customizable settings
- Ideal for scalpers using M1 and M5 charts
By showing where synthetic and actual cross currency prices diverge, the I Cross Main Indicator for MT4 allows traders to act quickly and capitalize on arbitrage opportunities with confidence.
Download the I Cross Main Indicator for MT4 today and start spotting profitable cross currency discrepancies!
FAQ
Published:
Mar 26, 2026 09:49 AM
Category: