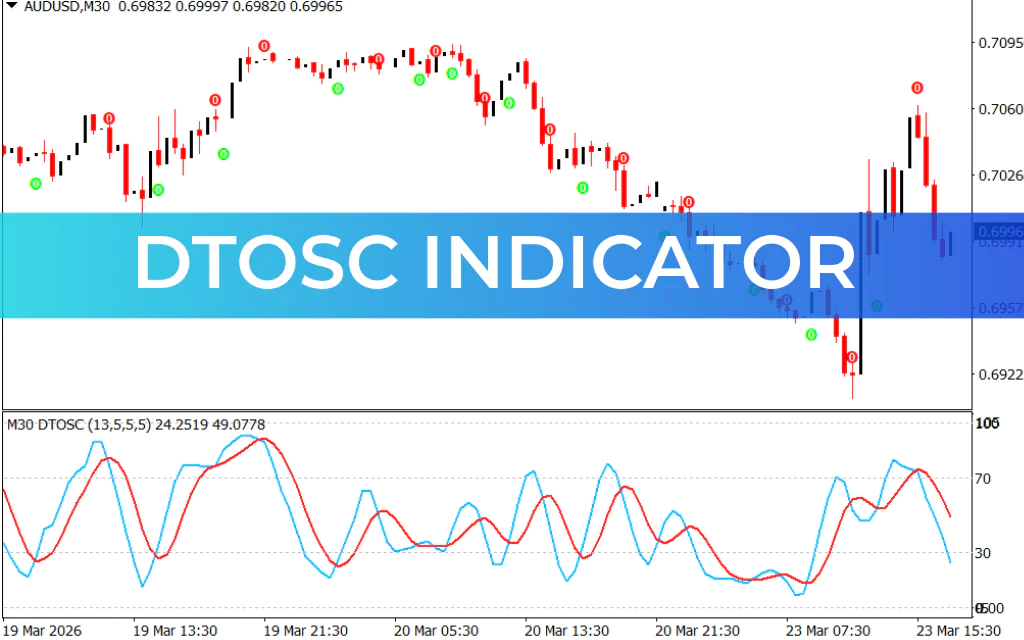
The DTOSC Indicator for MT4 (Dynamic Trader Oscillator) is a powerful momentum-based tool that combines the strengths of the Stochastic Oscillator and the Relative Strength Index (RSI). By applying a stochastic calculation to RSI values, it delivers highly responsive signals for identifying overbought and oversold market conditions.
This hybrid approach allows traders to spot potential reversals earlier and execute trades with greater precision. Whether you're a beginner or an experienced trader, the DTOSC indicator offers a simple yet effective way to enhance your trading strategy.
How the DTOSC Indicator Works
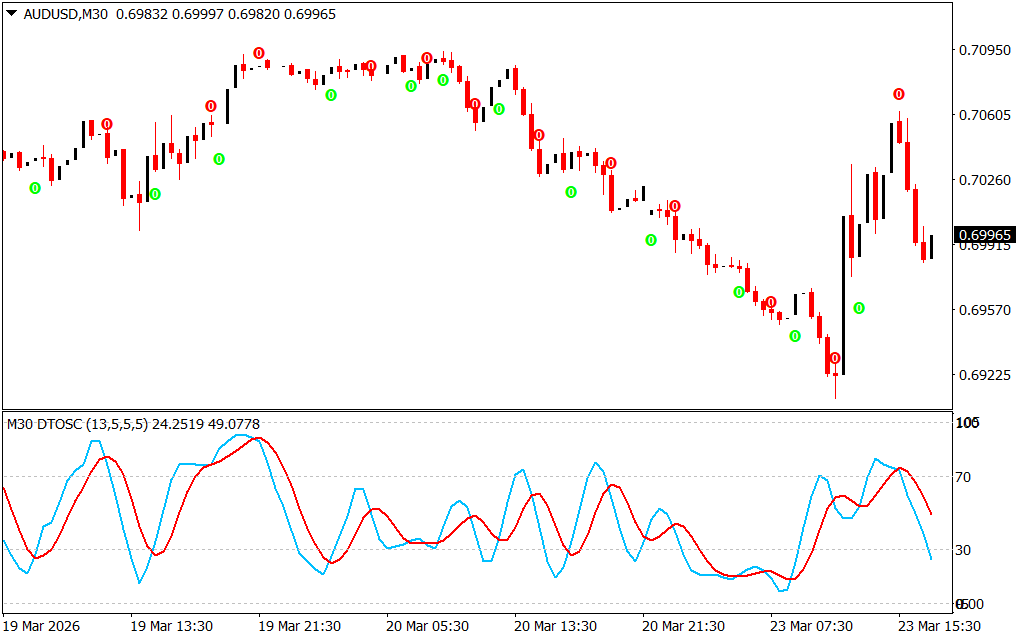
The DTOSC indicator is displayed in a separate window below your price chart and consists of two lines:
- Blue Line (Fast Line)
- Red Line (Signal Line)
These lines oscillate between overbought and oversold zones, helping traders identify extreme market conditions and potential trend reversals.
Key Concept:
- Overbought Zone → Market may reverse downward
- Oversold Zone → Market may reverse upward
DTOSC Trading Signals Explained
📈 Buy Signal
- The blue line crosses above the red line
- Ideally occurs in or near the oversold zone
- Confirms the start of a bullish trend cycle
- Place stop-loss below the previous swing low
📉 Sell Signal
- The blue line crosses below the red line
- Ideally occurs in or near the overbought zone
- Indicates a bearish trend cycle
- Place stop-loss above the previous swing high
Best Exit Strategies
- Exit at the opposite crossover signal
- Or use a fixed risk-to-reward ratio (e.g., 1:2 or 1:3)
- Combine with support/resistance for precise profit targets
Why Use the DTOSC Indicator?
- ✔️ Combines RSI + Stochastic for better accuracy
- ✔️ Identifies early trend reversals
- ✔️ Works on all timeframes (MTF compatible)
- ✔️ Easy-to-read crossover signals
- ✔️ Suitable for Scalping, day trading, and swing trading
Pro Tips for Better Results
- Use DTOSC on higher timeframes (H4, Daily) for stronger signals
- Combine with trend indicators (like Moving Averages)
- Avoid trading in sideways/choppy markets
- Confirm signals with Price Action patterns
Conclusion
The DTOSC Indicator for MT4 is a versatile and reliable trading tool that simplifies the process of identifying overbought and oversold conditions. With its clear crossover signals and multi-timeframe compatibility, it helps traders pinpoint high-probability trade setups with ease.
For best performance, combine it with other technical tools and maintain proper risk management.
FAQ
4 Downloads
Published:
Mar 23, 2026 12:43 PM
Category: