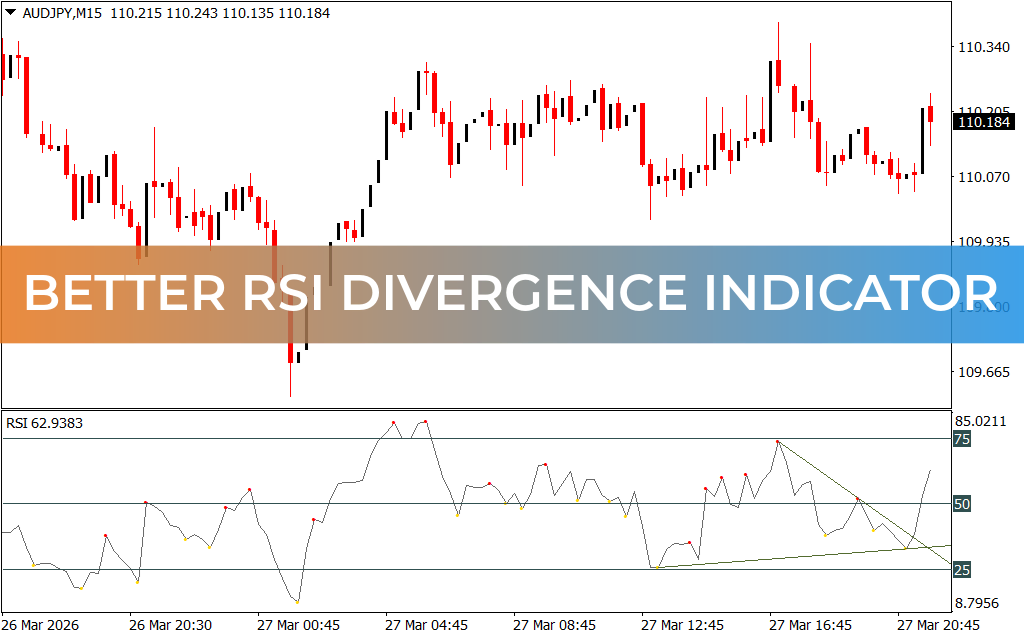
The RSI Divergence Indicator for MT4 combines the power of RSI, Stochastic, Moving Averages, and convergence/divergence analysis to deliver clear bullish and bearish reversal signals. This makes it an essential tool for forex traders using technical analysis and reversal trading strategies.
Key Features of RSI Divergence Indicator
- Visual Signals: Red dots indicate sell signals, while golden dots indicate buy opportunities.
- Trend and Divergence Lines: Plots lines on the indicator window to highlight potential price reversals.
- Suitable Timeframes: Works best on chart frames higher than 15 minutes.
How to Trade with RSI Divergence
The indicator provides actionable trading signals based on RSI levels and divergence analysis:
- Buy Signal: Golden dots appear below the lower RSI level, signaling a potential bullish reversal.
- Sell Signal: Red dots appear above the upper RSI level, indicating a potential bearish reversal.
- Convergence & Divergence: Lines plotted on the chart help confirm potential reversals. Avoid trading signals when RSI is between upper and lower thresholds.
- Risk Management: The indicator does not provide stop loss or take profit levels. Traders should manage trades using a favorable risk-reward ratio.
By combining multiple indicators, RSI Divergence gives traders a clearer picture of market reversals and potential entry points, improving the likelihood of profitable trades.
Why Traders Use RSI Divergence
The RSI Divergence Indicator is ideal for traders focusing on reversal strategies. Its combination of RSI, stochastic, moving averages, and divergence analysis provides high-quality signals that can enhance decision-making and trade timing.
Conclusion
In summary, the RSI Divergence Indicator for MT4 helps forex traders identify reliable bullish and bearish reversals. Its multi-indicator approach makes it a powerful tool for traders aiming to capture profitable market turns.
FAQ
2 Downloads
Published:
Mar 27, 2026 19:21 PM
Category: