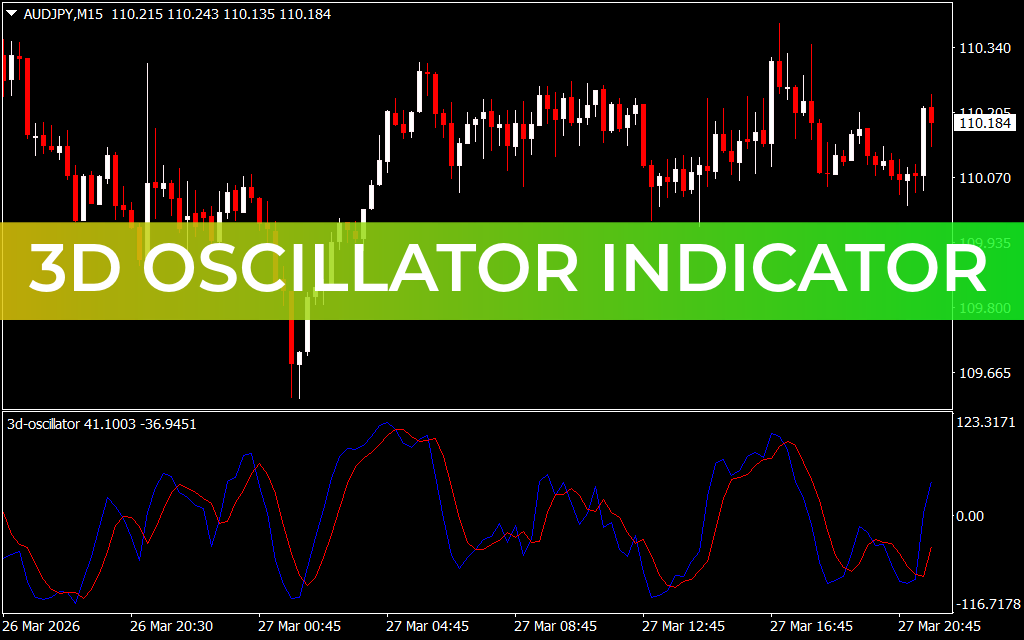
The 3D Oscillator Indicator for MT4 is an advanced upgrade of the traditional stochastic tool, designed to help traders identify high-probability entry and exit points with improved accuracy.
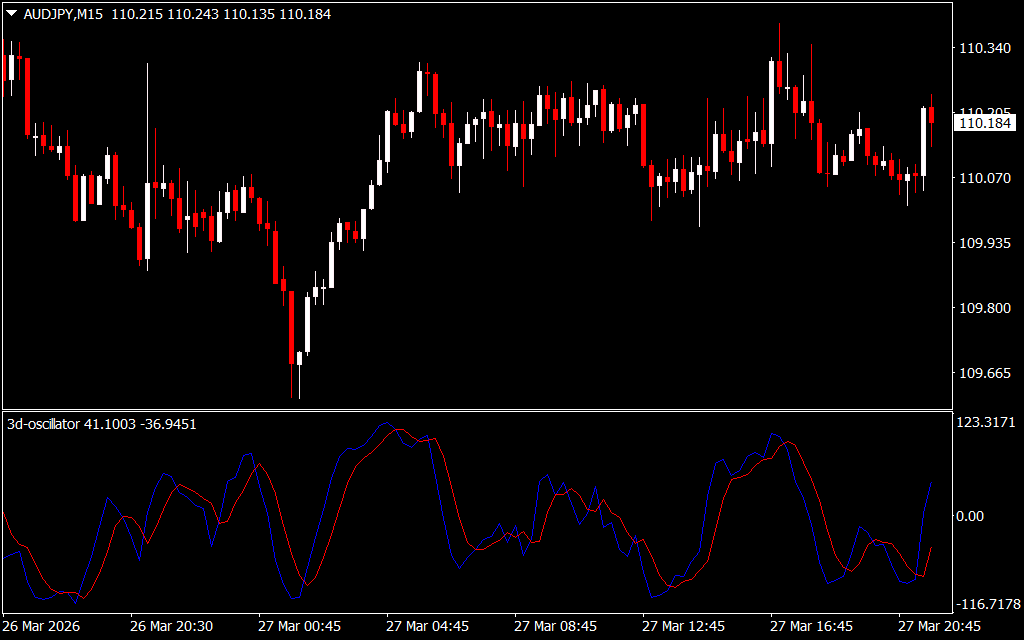
This indicator consists of two key components: the %K line and the %D line. The %K line reflects the current market position, while the %D line acts as a moving average of %K, generating trading signals and confirming potential market reversals.
One of the major advantages of the 3D Oscillator Indicator is its versatility—it works effectively across all timeframes, just like the classic stochastic oscillator. However, for more reliable signals and reduced market noise, it is recommended to use it on higher timeframes such as H4 or Daily charts.
How the 3D Oscillator Indicator Works
The indicator helps traders spot overbought and oversold market conditions, which are essential for timing trades.
- When the oscillator rises above 80, it indicates that the asset may be overbought, signaling a potential sell (short) opportunity.
- When the oscillator drops below 20, it suggests the asset may be oversold, indicating a possible buy (long) opportunity.
These levels allow traders to anticipate price reversals and act accordingly.
Identifying Buy and Sell Signals
Using the 3D Oscillator Indicator on platforms like MT4 is straightforward:
- Buy Signal: When the oscillator crosses below 20 and starts moving upward
- Sell Signal: When the oscillator crosses above 80 and starts moving downward
For best results, always confirm signals with Price Action or additional indicators.
Using Divergence for Better Accuracy
Another powerful feature of the 3D Oscillator Indicator is its ability to detect divergence:
- Bearish Divergence: Price makes a higher high while the oscillator forms a lower high → Possible downward reversal
- Bullish Divergence: Price makes a lower low while the oscillator forms a higher low → Possible upward reversal
Divergence often signals weakening momentum and can help traders anticipate trend reversals early.
Best Practices for Trading
While the 3D Oscillator Indicator is a strong standalone tool, combining it with other technical indicators can significantly improve accuracy. Consider using:
- Trend indicators (e.g., moving averages)
- Support And Resistance levels
- Price action confirmation
Market conditions can vary, so using multiple confirmations helps reduce false signals and improves trading consistency.
Conclusion
The 3D Oscillator Indicator for MT4 enhances the traditional stochastic approach by clearly identifying overbought and oversold levels, helping traders make informed decisions. Whether you are a beginner or an experienced trader, this tool can improve your ability to time entries and exits effectively when used with proper risk management and confirmation strategies.
FAQ
Published:
Mar 28, 2026 18:35 PM
Category: