identify volume strength, market peaks, and potential price reversal zones. By analyzing price movement together with trading volume, the indicator highlights important moments when the market may change direction or continue its trend.
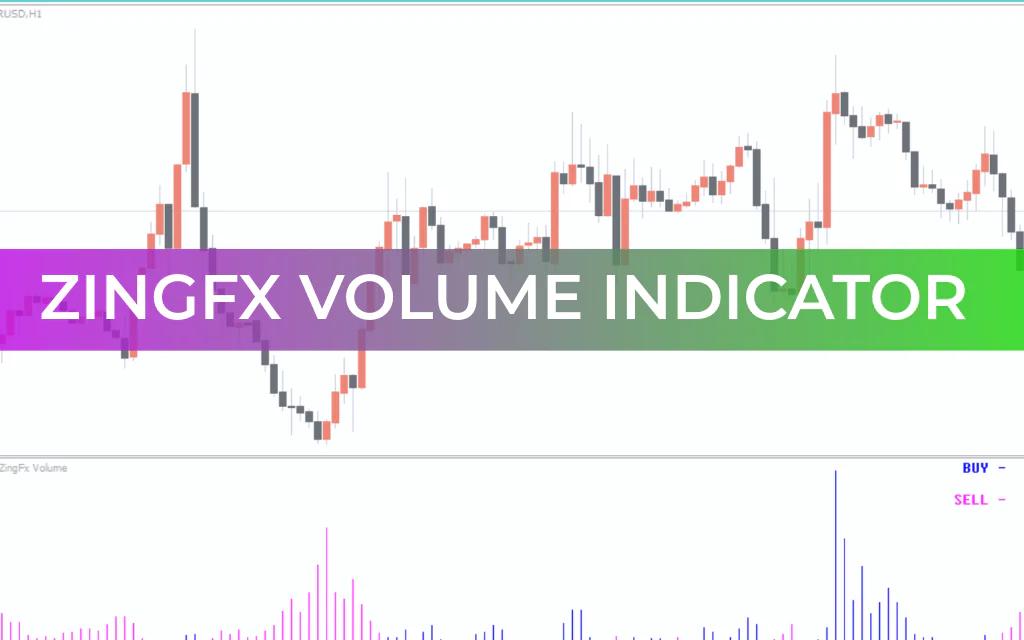
This indicator uses a histogram-style display to represent different market conditions, making it easy for traders to quickly interpret bullish or bearish momentum. Because of its clear visual signals, the ZingFX Volume Indicator is suitable for beginner, intermediate, and advanced traders.
It can also be applied to different trading styles, including Scalping, intraday trading, and swing trading.
How the ZingFX Volume Indicator Works
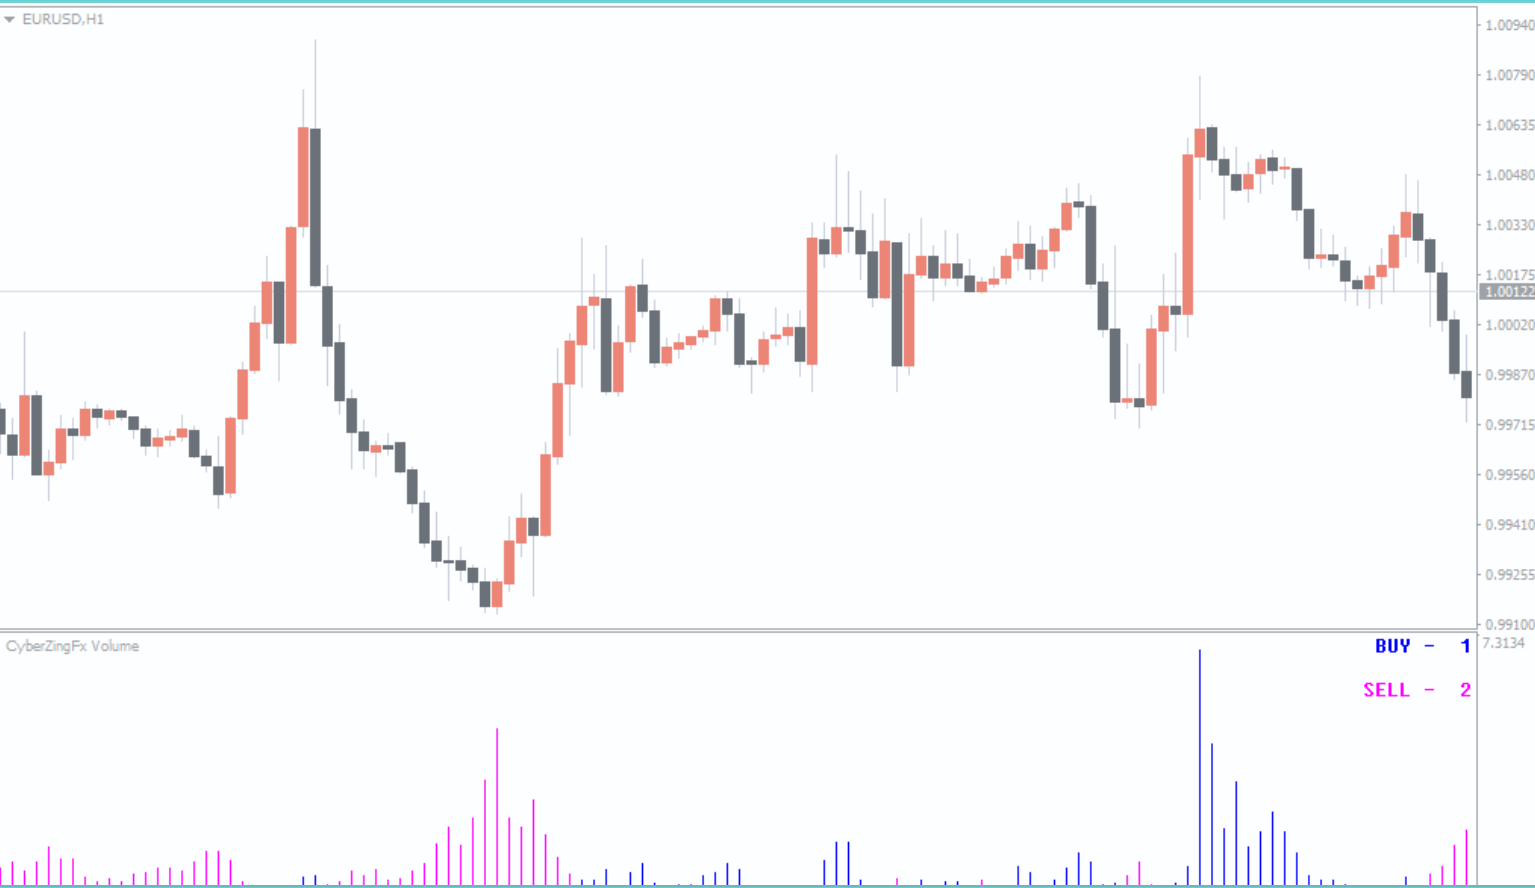
The ZingFX Volume Indicator analyzes price peaks and trading volume using built-in algorithms. Based on these calculations, it displays colored histogram bars below the price chart to show the current market condition.
Each histogram color represents a specific trading signal:
- Blue Bars – Indicate strong bullish volume momentum.
- Magenta Bars – Indicate strong bearish volume momentum.
- Green Bars – Represent potential bullish peak reversal zones.
- Red Bars – Represent potential bearish peak reversal zones.
These visual signals help traders quickly determine whether the market is gaining momentum or approaching a potential reversal point.
How to Trade With the ZingFX Volume Indicator
When applied to a MetaTrader 4 chart, the indicator appears in a separate window below the price chart, displaying its colored histogram bars.
Although the indicator provides useful signals, it is recommended to combine it with Price Action analysis or other technical indicators to improve trading accuracy.
Buy Signal
To identify a potential buy setup, traders should follow these steps:
- Wait for the indicator to display a red histogram bar, which signals a price peak and a possible end of a downtrend.
- After the red bar appears, look for bullish reversal candlestick patterns on the price chart, such as a bullish engulfing or hammer pattern.
- Once confirmation appears, traders may consider opening a buy position.
Alternatively, traders may wait for the indicator to print blue histogram bars, indicating strong bullish volume momentum, before entering the trade.
Sell Signal
The same principle can be applied to identify sell setups.
- Wait for signals suggesting a peak in the upward price movement.
- Look for confirmation through bearish reversal candlestick patterns.
- When the indicator begins displaying magenta bars, it may signal strong bearish volume pressure, confirming a potential sell opportunity.
This approach allows traders to combine volume analysis with price action for better decision-making.
Advantages of the ZingFX Volume Indicator
The ZingFX Volume Indicator offers several benefits:
- Detects volume strength and trend momentum
- Identifies potential market reversal zones
- Provides easy-to-read colored histogram signals
- Suitable for multiple trading styles
- Works well with price action and other indicators
- Compatible with forex and other financial markets
Because of its flexibility, the indicator can be integrated into various trading strategies.
Conclusion
The ZingFX Volume Indicator for MT4 is an effective tool for analyzing market momentum and identifying potential trend reversals. By combining volume analysis with peak detection, it helps traders recognize important turning points in the market.
When used alongside price action or additional technical indicators, the ZingFX Volume Indicator can significantly improve trading accuracy and market timing.
Download ZingFX Volume Indicator for MT4 for Free Now!
FAQ
3 Downloads
Published:
Mar 09, 2026 08:25 AM
Category: