The Weekly HiLo Indicator for MT4 is a simple yet highly effective technical tool that identifies and plots the previous week’s high and low price levels. These levels act as strong Support And Resistance zones, making the indicator ideal for traders who focus on trend continuation and breakout strategies.
Despite its simplicity, this indicator is widely valued for highlighting some of the most reliable price levels in the market.
What Is the Weekly HiLo Indicator?
The Weekly HiLo Indicator automatically marks:
- Last Week’s High – A key resistance level
- Last Week’s Low – A key support level
These levels are based on historical Price Action and are often used by traders to identify important decision zones where price may react.
Why Highs and Lows Matter in Trading
High and low levels are crucial because they:
- Represent strong support and resistance zones
- Reflect market sentiment and trader behavior
- Help identify breakout and reversal opportunities
The Weekly HiLo indicator focuses specifically on weekly levels, which are generally more reliable than shorter timeframe levels.
Key Features
- Automatically plots last week’s high and low
- Acts as a strong support and resistance indicator
- Highlights breakout opportunities
- Works on all timeframes
- Suitable for Scalping, intraday, and swing trading
- Beginner-friendly and easy to use
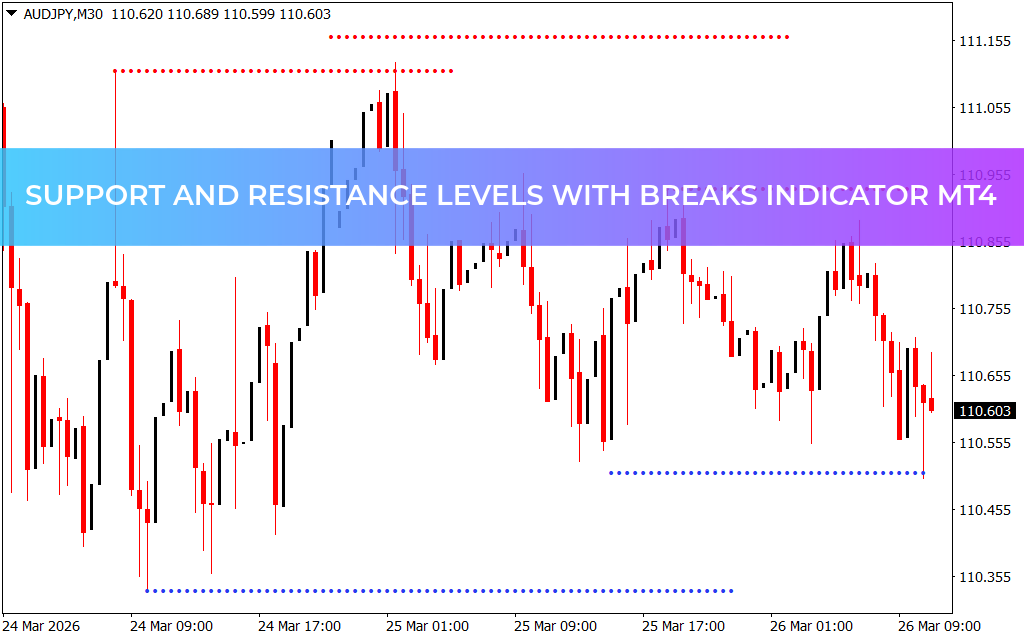
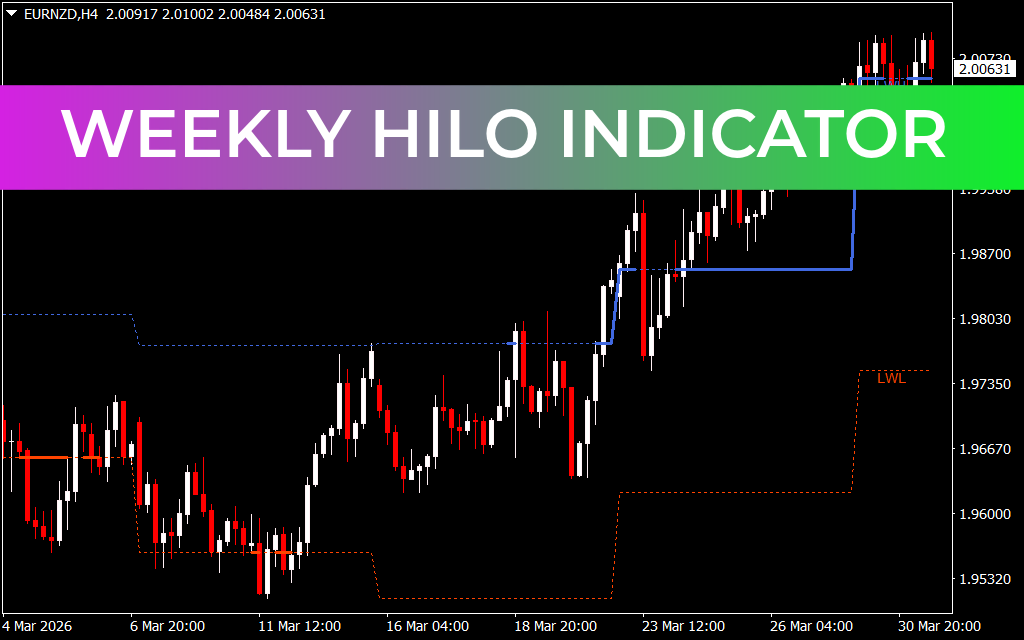
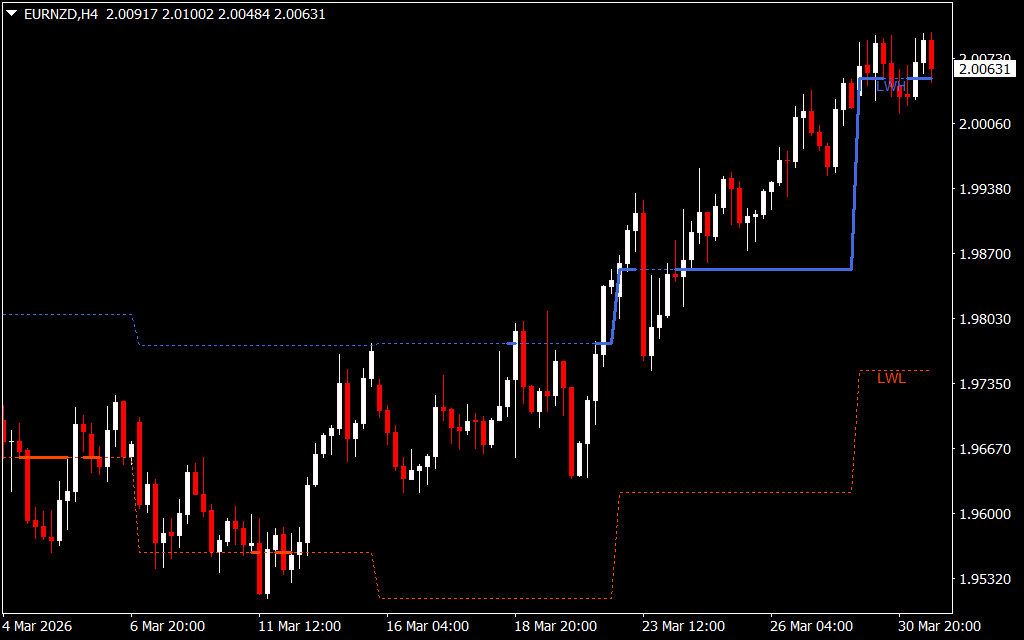
How the Indicator Works
- Blue Dotted Line: Last week’s high (resistance)
- Orange/Red Dotted Line: Last week’s low (support)
- Thicker Lines: Indicate breakout beyond these levels
These visual cues help traders quickly identify potential trade setups.
How to Trade With the Weekly HiLo Indicator
🟢 Buy Opportunities
Bounce Strategy:
- When price touches the weekly low and moves upward
- Indicates a potential bullish reversal
- Enter a buy trade
Breakout Strategy:
- When price breaks above last week’s high
- Signals bullish momentum
- Enter a buy trade
🔴 Sell Opportunities
Bounce Strategy:
- When price hits the weekly high and moves downward
- Suggests a bearish reversal
- Enter a sell trade
Breakout Strategy:
- When price breaks below last week’s low
- Indicates strong bearish continuation
- Enter a sell trade
Best Trading Practices
- Combine with price action (candlestick patterns) for confirmation
- Use higher timeframes (H1, H4, Daily) for better accuracy
- Avoid trading during sideways or low-volatility markets
- Apply proper stop-loss and risk management
Why Use the Weekly HiLo Indicator?
- Focuses on highly reliable weekly price levels
- Helps identify both reversal and breakout trades
- Reduces chart clutter with simple visualization
- Suitable for all trading styles and experience levels
Conclusion
The Weekly HiLo Indicator for MT4 is a powerful yet straightforward tool that highlights previous weekly highs and lows, providing traders with key support and resistance zones.
Whether you’re trading breakouts or reversals, this indicator offers a reliable way to identify high-probability trading opportunities across different market conditions.
1 Download
Published:
Mar 31, 2026 08:01 AM
Category: