The Volume Average Percent Indicator is a powerful yet easy-to-use tool designed for traders who want to evaluate trading volume relative to past activity in MetaTrader 5. By expressing volume as a percentage, this indicator helps identify unusually high or low market participation—key signals for spotting potential trend continuations and reversals.
What Is the Volume Average Percent Indicator?
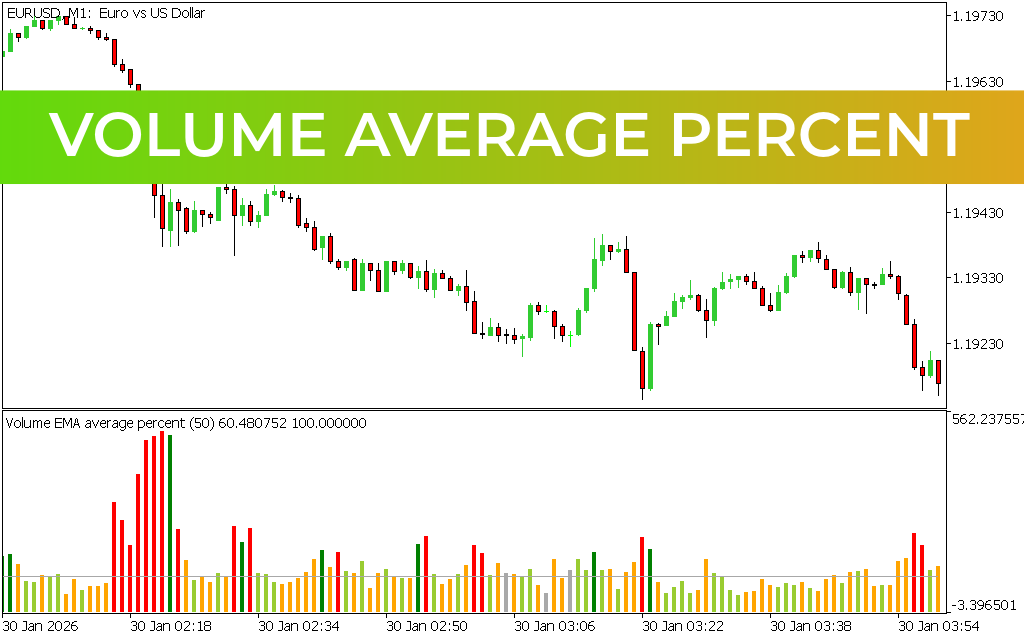
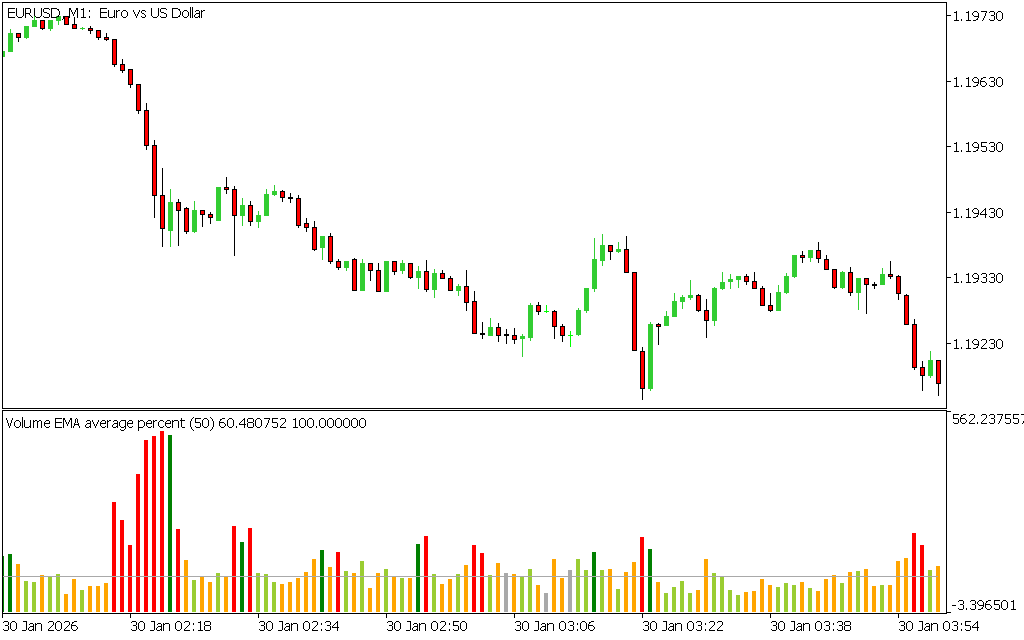
This indicator calculates trading volume as a percentage relative to a selected period using an Exponential Moving Average (EMA). Instead of showing raw volume data, it highlights how current activity compares to historical averages.
A baseline level of 100% is used:
- Values above 100% indicate higher-than-average volume
- Values below 100% suggest lower market activity
How the Indicator Works
The Volume Average Percent Indicator displays colored histogram bars in a separate window:
- Green Bars – High volume during upward price movement (bullish strength)
- Red Bars – High volume during downward price movement (bearish pressure)
- Light Green / Orange Bars – Transitional or moderate volume conditions
Bars that exceed the 100% level signal strong market participation, often linked to institutional activity or breakout conditions.
How to Use the Indicator in Trading
This indicator does not generate automatic buy/sell signals. Instead, it helps traders interpret volume strength and align trades with market momentum.
Buy Signal (Bullish Setup)
- Green bars appear with increasing height
- Volume exceeds the 100% level
- Indicates strong buying pressure
In this scenario, traders may consider entering long positions, especially when supported by an established uptrend.
Sell Signal (Bearish Setup)
- Red bars appear and grow taller
- Volume rises above 100% during price declines
- Suggests strong selling pressure
This can signal an opportunity to enter short positions, particularly in a confirmed downtrend.
Identifying Market Reversals
The indicator is also useful for spotting potential reversals:
- A color shift (green to red or vice versa) may indicate changing sentiment
- Declining momentum despite high volume can signal exhaustion
Traders often use this alongside tools like RSI or support/resistance analysis for confirmation.
Key Advantages
- Displays relative volume strength clearly in percentage terms
- Uses EMA for smoother and more responsive analysis
- Helps identify high-impact trading zones
- Works across all timeframes and markets
Limitations
- Does not independently define trend direction
- Requires confirmation from other indicators or Price Action
- Not ideal as a standalone trading system
Final Thoughts
The Volume Average Percent Indicator is an excellent addition for traders who want deeper insights into market participation. By focusing on relative volume rather than raw data, it highlights key moments when trading activity significantly deviates from the norm.
For best results, combine it with trend analysis and complementary indicators to build a well-rounded trading strategy.
Published:
Apr 13, 2026 06:52 AM
Category: