How the TTM Scalper Indicator Works
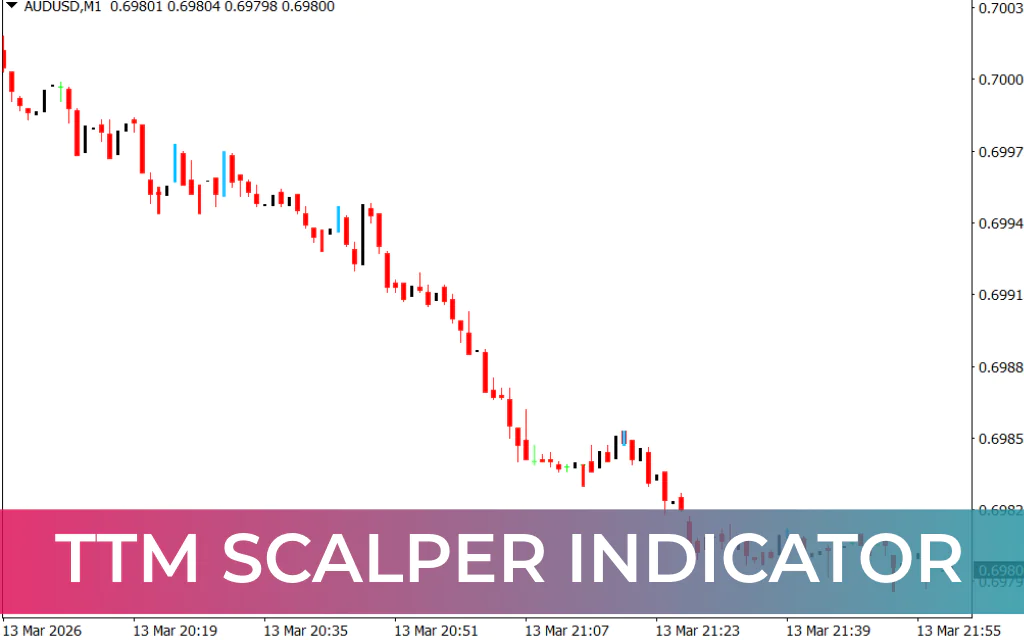
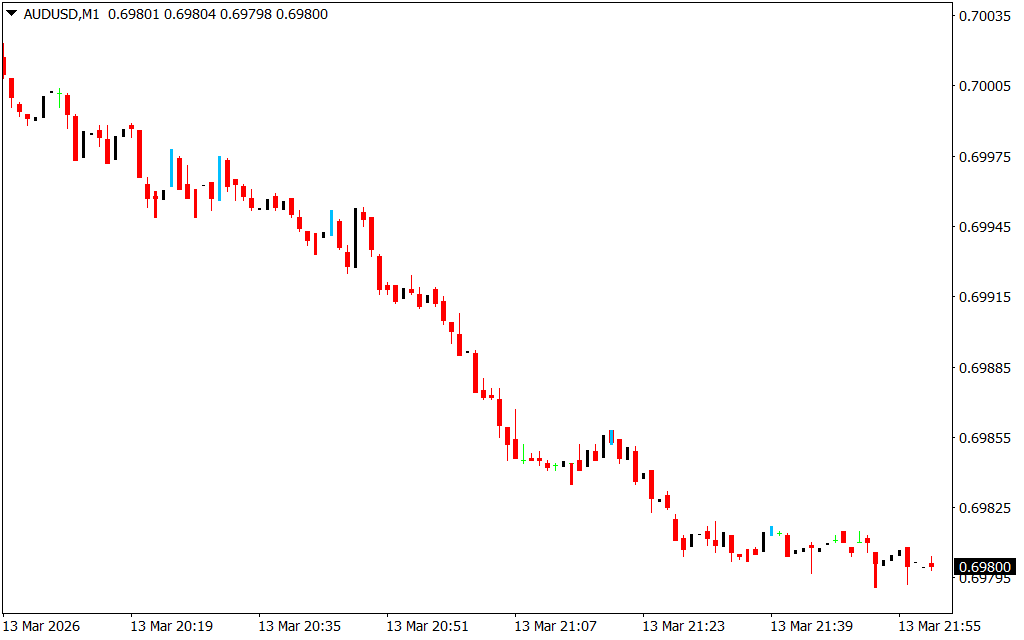
- Reversal Detection → The indicator identifies potential highs and lows of price waves, signaling possible price flips.
- Signal Bars →
- Blue Vertical Bar → Indicates a bearish reversal opportunity.
- Red Vertical Bar → Indicates a bullish reversal opportunity.
MTF Compatibility → Works well for multi-timeframe (MTF) analysis, helping traders align short-term and long-term strategies.
Key Concept: The indicator does not automatically suggest every colored bar as a trade. Traders need to filter signals to improve accuracy and align with broader trends.
How to Trade with TTM Scalper Indicator
- Identify the Trend → Use trendlines or other trend-following indicators to determine the market direction.
- Observe the Signal Bars →
- Enter BUY near support levels when a red bar appears.
- Enter SELL near resistance levels when a blue bar appears.
- Filter Signals → Avoid taking reversal trades near market highs (for buys) or lows (for sells) to reduce false signals.
- Combine with Support/Resistance → Use trendlines, pivot levels, or other MT4 tools to validate swing trading entries.
Example: On GBPUSD, each blue TTM Scalper bar near a trendline resistance resulted in a solid bearish move, providing profitable shorting opportunities.
Advantages
✅ Detects potential swing trading setups quickly
✅ Provides visual reversal signals with colored bars
✅ Compatible with multiple timeframes (1-min to 4-hour)
✅ Works across all MT4 instruments: forex, stocks, commodities, ETFs
✅ Easy to use for both novice and advanced traders
Conclusion
The TTM Scalper Indicator for MT4 is an easy-to-follow swing trading tool that highlights potential price reversals. While it offers real-time colored bar signals, its effectiveness improves when combined with trendlines, support/resistance, and other technical analysis tools. This makes it suitable for both intraday and short-term swing trades, enabling traders to capitalize on price momentum efficiently.
FAQ
Published:
Mar 14, 2026 08:55 AM
Category: