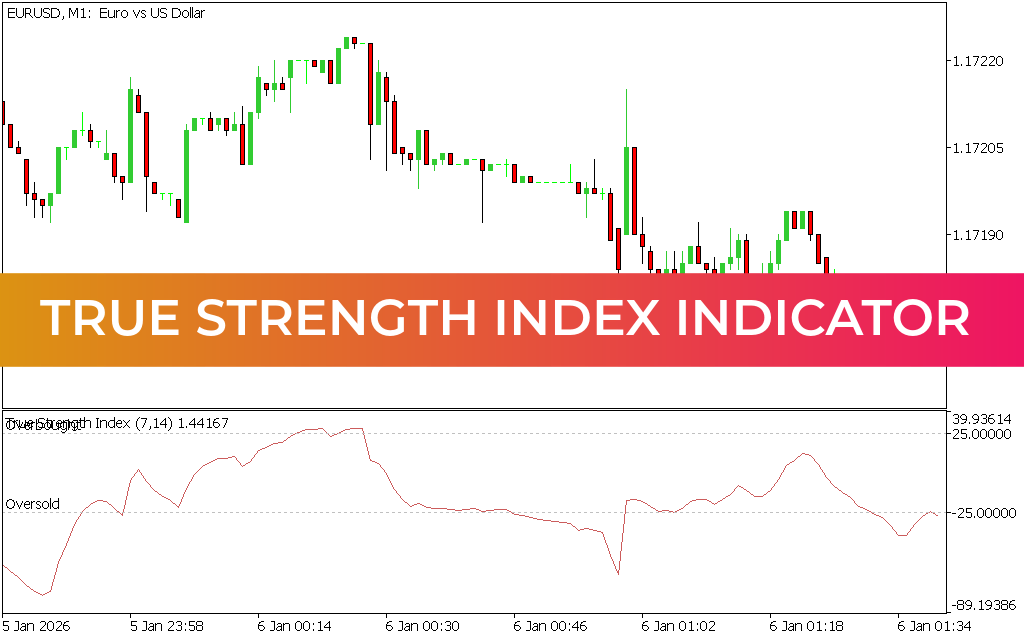
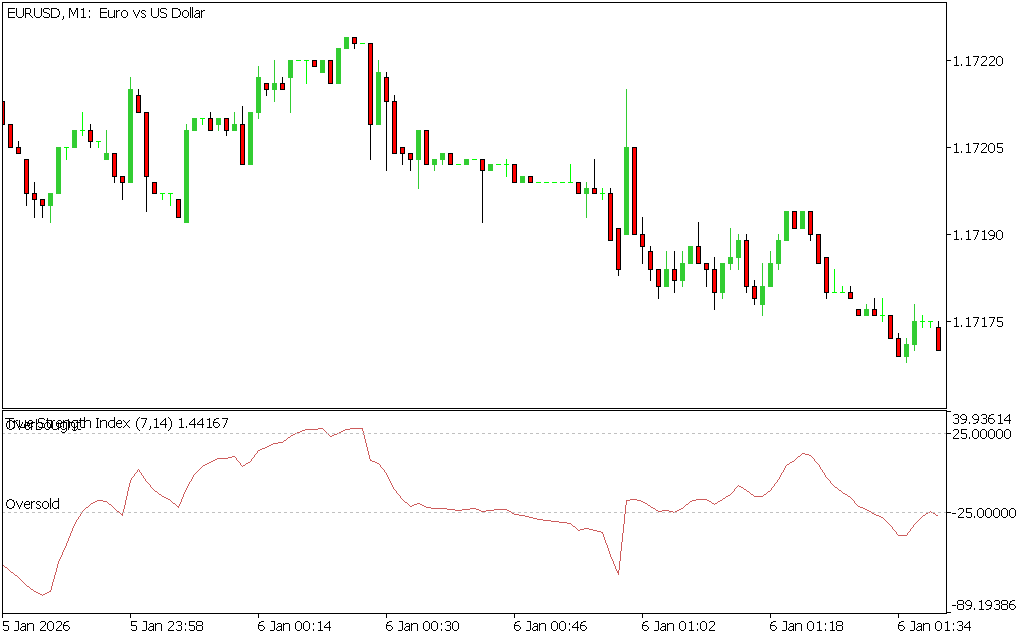
The True Strength Index (TSI) Indicator for MetaTrader is a powerful momentum oscillator designed to help traders analyze the strength and direction of price movements. By tracking changes in momentum, the TSI provides valuable insights into whether the market is gaining bullish or bearish strength.
This indicator is especially useful for traders who want a clearer understanding of trend dynamics without relying solely on Price Action.
How the True Strength Index Works
The TSI indicator revolves around a central zero line, which acts as the key reference point for interpreting market momentum:
- Above 0.00: Indicates bullish momentum
- Below 0.00: Indicates bearish momentum
This simple structure allows traders to quickly assess the overall strength and direction of the market trend.
Key Features and Benefits
The True Strength Index offers several advantages that make it a valuable addition to any trading strategy:
- Tracks real-time momentum changes
- Helps identify trend direction
- Smooth and responsive to price movement
- Suitable for Scalping, intraday, and swing trading
- Works for both beginners and advanced traders
Its near lag-free nature ensures timely insights into shifting market conditions.
How to Use the TSI Indicator in Trading
Unlike many indicators, the True Strength Index does not generate direct BUY or SELL signals. Instead, it acts as a confirmation tool to support your trading decisions.
Momentum-Based Analysis
- Use the TSI to confirm Trend Strength before entering trades
- Trade in the direction of momentum (above zero for buys, below zero for sells)
Confluence with Other Tools
For best results, combine the TSI with:
- Price action strategies
- Support and resistance levels
- Other technical indicators
This approach improves the accuracy of your entries and exits.
Identifying Market Conditions
The TSI can also help identify potential market extremes:
- Rising sharply above zero → Strong bullish momentum
- Falling sharply below zero → Strong bearish momentum
- Flattening near zero → Weak or ranging market
Although it can hint at overbought or oversold conditions, the TSI does not provide fixed levels, so interpretation requires experience.
Best Practices for Better Results
To maximize effectiveness:
- Use higher timeframes for more reliable momentum signals
- Avoid trading during low-momentum conditions
- Always confirm signals with additional analysis
- Apply proper risk management strategies
Final Thoughts
The True Strength Index Indicator for MT5 is a reliable and easy-to-use tool for monitoring market momentum and trend direction. While it does not provide direct trading signals, it plays a crucial role in confirming trade setups and improving decision-making.
If you're looking to enhance your trading strategy with a responsive and insightful Momentum Indicator, the TSI is definitely worth adding to your toolkit.
3 Downloads
Published:
Apr 13, 2026 11:38 AM
Category: