One of the biggest reasons traders are attracted to the forex market is its 24-hour trading cycle. Unlike many other financial markets, forex operates continuously from Monday to Friday, allowing traders around the world to participate at any time. Because participants from different regions trade at different times, the market often experiences significant volatility, creating opportunities to find profitable entry points.
When traders in one region finish their trading day, another region begins. For example, while traders in Western countries may be resting, traders in Eastern countries are actively participating in the market.
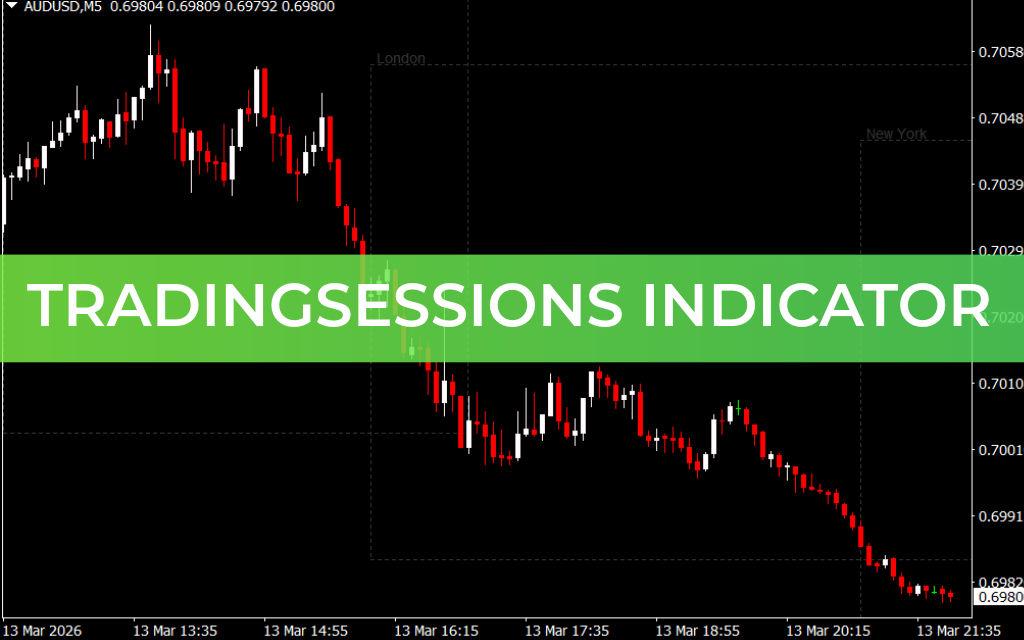
Unfortunately, the default MetaTrader 4 (MT4) platform does not include a built-in tool that clearly shows when traders from different regions enter the market. This is where the TradingSessions indicator becomes extremely useful. It visually displays major global trading sessions directly on the chart, helping traders understand when market activity is likely to increase.
Key Features of the TradingSessions Indicator
The TradingSessions indicator highlights the major forex trading sessions on your chart, making it easier to track global market activity. Each session is displayed with clear visual markers so traders can quickly identify when specific markets are active.
Main Features
- Displays all major forex trading sessions directly on the chart
- Shows the session name, trading hours, and acronym
- Marks sessions using rectangles that reflect price movement
- Displays both past and upcoming sessions
- Works best on M30 timeframe and higher
- Simplified display on H1 and higher timeframes
Each trading session lasts roughly 9 hours, which causes some sessions to overlap. These overlaps are particularly important because they often generate the highest market volatility.
Forex Session Overlaps
- Tokyo and London: overlap for about 1 hour
- London and New York: overlap for about 4 hours
- Sydney and Tokyo: overlap for about 7 hours
Among these, the London–New York overlap is widely known as the most active trading period, often producing strong price movements and increased liquidity.
How the Indicator Works
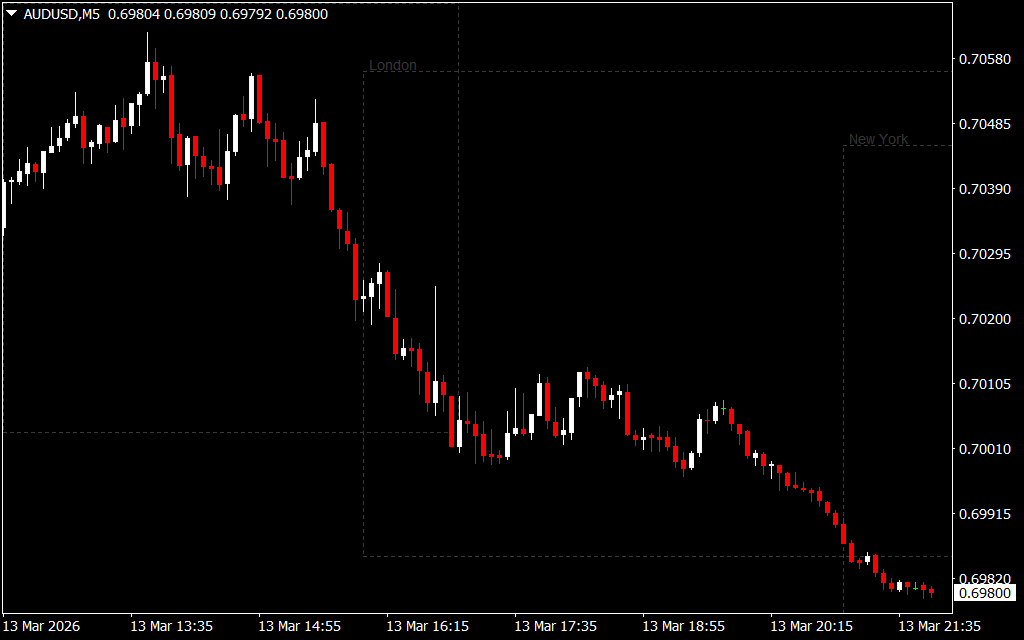
The indicator marks trading sessions using rectangles on the chart.
- Rectangle height: reflects how much the price moved during that session
- Rectangle width: corresponds to the timeframe used
For example:
- On the M30 timeframe, each trading session spans 18 bars.
The indicator also places the session acronym at the top-left corner of the rectangle, making it easy to identify which session is active.
Because higher timeframes display fewer candles, the indicator uses a simplified visualization on H1 and above to maintain clarity.
How to Use the TradingSessions Indicator in Trading
The TradingSessions indicator does not generate trading signals on its own. Instead, it works best when combined with other technical analysis tools and indicators.
For example, traders often pair it with trend-analysis tools such as AutoTrendLines to identify strong market movements during high-liquidity sessions.
Example Trading Scenario
During the London and New York sessions, the market often experiences strong price movements. When these sessions overlap, volatility can increase significantly.
In a typical scenario:
- A trend line may show weakening selling pressure near an uptrend
- Long candlestick shadows indicate strong buying interest
- New bullish waves may begin forming during the London or New York session
These signals may indicate a potential continuation of an uptrend.
Suggested Trading Approach
A safer strategy may include:
- Placing a pending order at the level where the previous downward wave started.
- Waiting for a breakout confirmation.
- Setting a stop-loss below the trend line and candlestick shadows to protect against unexpected price reversals.
This approach allows traders to take advantage of the high volatility periods during major trading sessions while managing risk effectively.
Why Traders Use the TradingSessions Indicator
Many forex traders rely on session indicators because they help answer key questions such as:
- When is the market most active?
- Which session produces the largest price movements?
- When do session overlaps occur?
By understanding market timing, traders can focus on periods with higher liquidity and better trading opportunities.
FAQ
Published:
Mar 15, 2026 18:30 PM
Category: