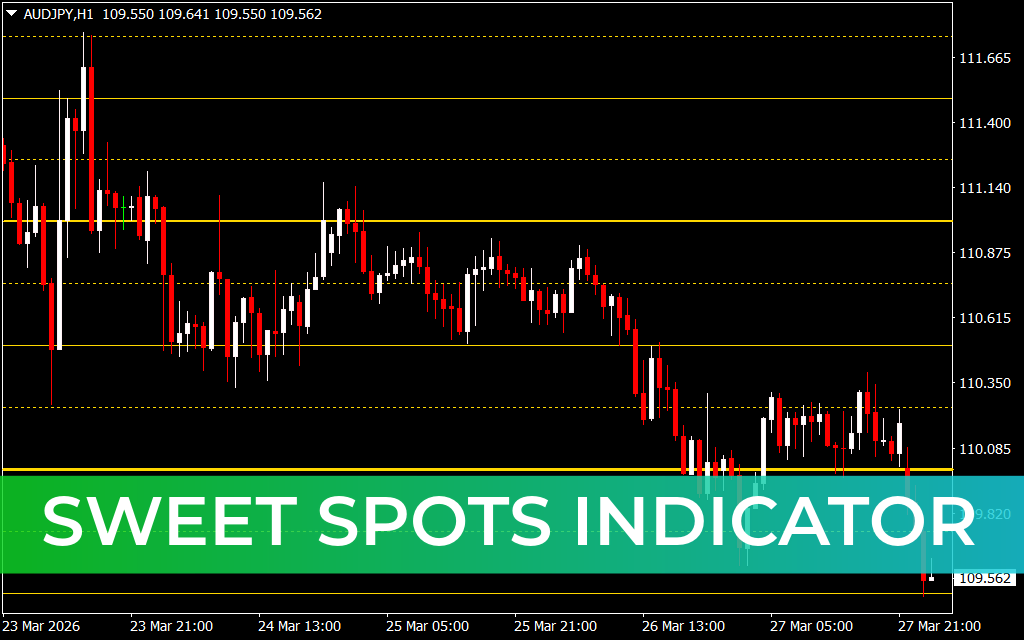
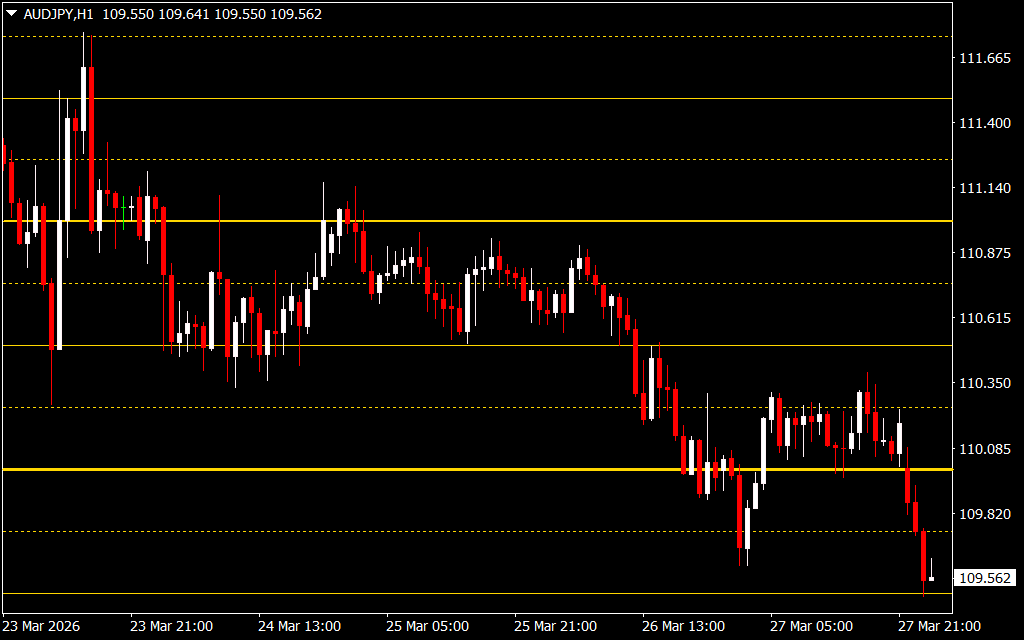
The Sweet Spots Indicator for MT4 is a powerful trading tool designed to highlight key psychological price levels—commonly known as round numbers—directly on your chart. These levels naturally act as strong Support And Resistance zones, where price frequently reacts due to high trading activity.
Widely used by institutional and professional traders, these “sweet spots” are often where major decisions are made, including stop-loss placements and profit-taking. With this indicator, you can instantly identify these critical levels without manual charting.
What Are Sweet Spots in Trading?
Sweet spots refer to round-number price levels (such as 1.1000 or 1.2000 in Forex markets) that attract significant market attention. These levels often influence price behavior because traders psychologically gravitate toward them when placing orders.
The Sweet Spots Indicator automatically plots these zones, giving traders a strategic edge in anticipating market reactions.
Key Features
- Automatic Round Number Detection
Identifies and displays key psychological price levels on your chart. - Dynamic Support and Resistance Zones
Highlights areas where price is likely to react or reverse. - Clean Chart Visualization
Keeps your analysis simple and uncluttered. - Multi-Timeframe Compatibility
Works effectively across all trading styles and timeframes. - Customizable Settings
Adjust level spacing and appearance based on your preferences.
How the Indicator Generates Trading Signals
The Sweet Spots Indicator provides actionable insights based on how price behaves around key levels:
- Resistance Signals
When price approaches a level and forms rejection candles, it often indicates strong resistance and a potential reversal. - Support Signals
If price holds above a level and consolidates, it suggests strong support and possible upward continuation. - Breakout Opportunities
A strong move above or below a sweet spot level may signal trend continuation, especially with high momentum. - Consolidation Zones
Price hovering around these levels often indicates accumulation or distribution phases.
How to Use It Effectively
For best results, combine the Sweet Spots Indicator with other technical tools such as:
- Moving averages for trend direction
- RSI for momentum confirmation
- Price Action patterns for entry timing
This multi-layered approach improves accuracy and reduces false signals.
Why Use the Sweet Spots Indicator?
- Identifies high-impact psychological levels instantly
- Improves timing of entries and exits
- Enhances support and resistance analysis
- Reduces manual chart work
- Works for Scalping, day trading, and swing trading
Final Thoughts
The Sweet Spots Indicator for MT4 is an essential tool for traders who want to leverage the power of psychological price levels. By automatically plotting key zones where price is likely to react, it provides a structured and efficient approach to market analysis.
Whether you're trading short-term movements or long-term trends, this indicator helps you make smarter, more confident trading decisions.
SEO Meta Description
FAQ
1 Download
Published:
Mar 29, 2026 21:09 PM
Category: