The Super Trend Histogram Indicator for MetaTrader 4 (MT4) is a powerful tool that simplifies trend analysis with a color-coded histogram. By visually highlighting bullish and bearish trends, this indicator helps traders quickly identify market direction and make informed trading decisions. Suitable for both beginners and experienced traders, it reduces market noise and provides a clear method for spotting profitable trade opportunities.
How the Super Trend Histogram Indicator Works
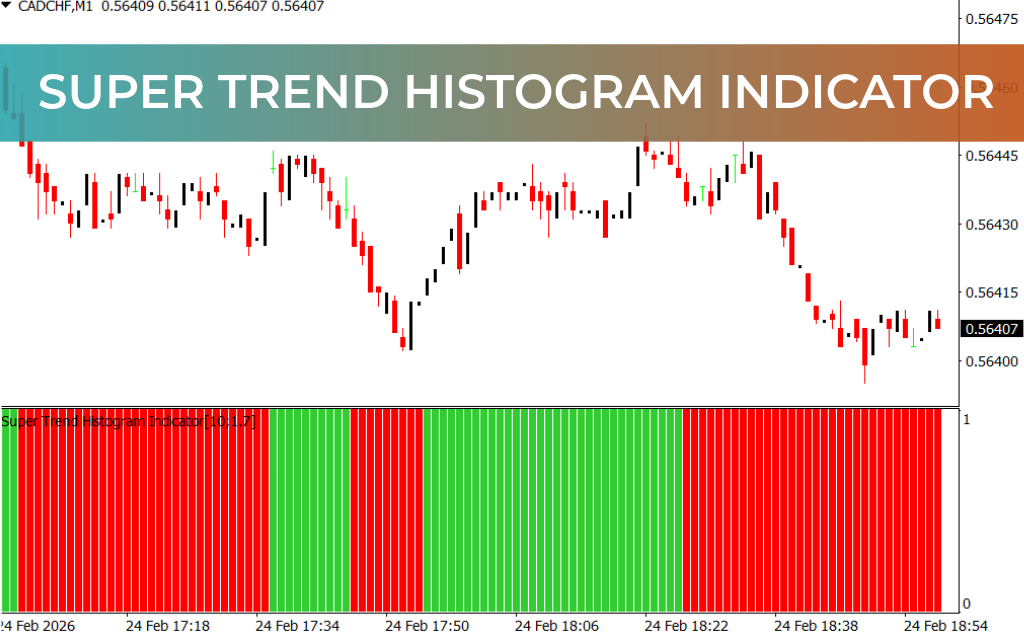
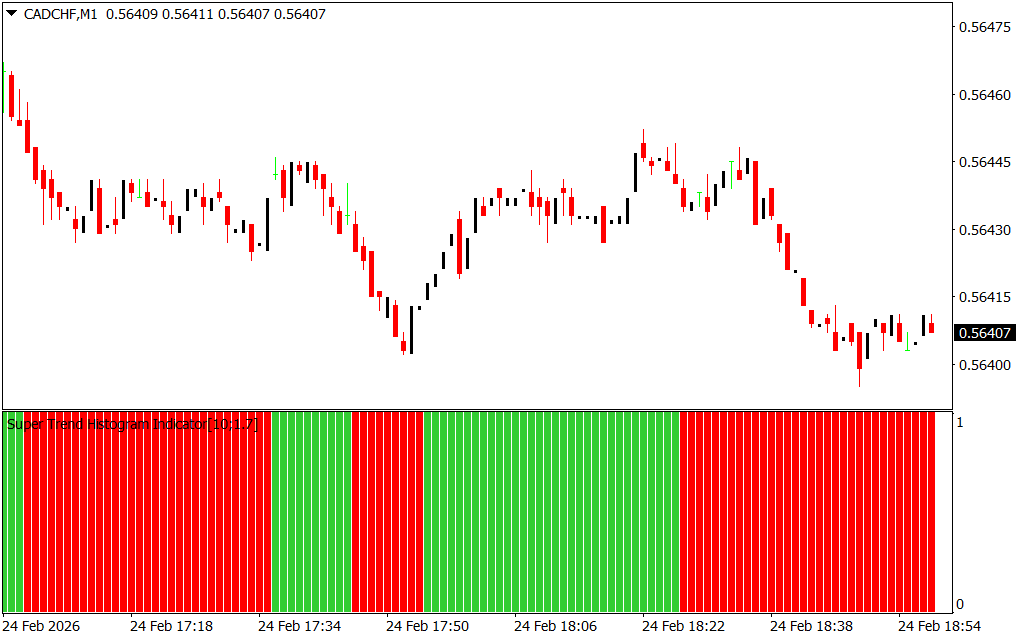
The indicator generates trading signals using dynamic histogram bars:
- Green Bars: Indicate bullish trends, signaling potential buy opportunities as they reflect strong upward momentum.
- Red Bars: Indicate bearish trends, signaling potential sell opportunities with strong downward momentum.
Transitions between green and red bars act as clear signals of trend shifts, allowing traders to time their entries and exits more effectively. The histogram adapts based on the Super Trend Period and Multiplier settings, ensuring signals are accurate and aligned with prevailing market conditions. Traders can also use these signals to confirm strategies such as breakouts or pullback entries, enhancing trade precision.
Key Features of the Super Trend Histogram Indicator
- Color-coded histogram for easy trend visualization
- Clear buy and sell signals with minimal noise
- Adjustable Super Trend Period and Multiplier for customized analysis
- Suitable for Forex, stocks, commodities, and other markets
- Enhances breakout and pullback trading strategies
- Compatible with MetaTrader 4 (MT4)
Why Traders Use the Super Trend Histogram Indicator
The Super Trend Histogram Indicator helps traders:
- Identify trend direction quickly and visually
- Reduce false signals caused by market noise
- Improve timing for entries and exits
- Confirm trading strategies with accurate trend data
Its simplicity, reliability, and visual clarity make it an essential tool for traders of all skill levels.
Conclusion
The Super Trend Histogram Indicator for MT4 transforms complex trend analysis into a simple, color-coded visual tool. By providing clear indications of market direction and momentum, it helps traders make faster, more informed decisions.
FAQ
1 Download
Published:
Feb 24, 2026 12:59 PM
Category: