Divergence is one of the most powerful concepts in technical analysis. It occurs when the price chart and a technical indicator move in opposite directions, indicating a potential change in market momentum.
The Stochastic Divergence Indicator for MT4 helps traders automatically detect divergences between price movements and the Stochastic oscillator, allowing them to identify potential trend reversals or trend continuation setups.
Instead of manually searching for divergences on charts, this indicator scans the market and highlights signals directly on the chart, helping traders capture profitable opportunities more efficiently.
What Is the Stochastic Divergence Indicator?
The Stochastic Divergence Indicator is a technical tool designed to detect divergence between the price chart and the Stochastic oscillator.
Divergences can signal either:
- A Trend Reversal
- A trend continuation
Because spotting divergences manually can be time-consuming and prone to error, this indicator automatically analyzes the market and alerts traders when divergence patterns appear.
Types of Divergences
Technical analysts generally classify divergences into two main categories.
Regular (Classic) Divergence
Regular divergence usually signals a potential trend reversal.
Bullish Divergence
- Price forms lower lows
- The indicator forms higher lows
This indicates weakening selling pressure and a possible upward reversal.
Bearish Divergence
- Price forms higher highs
- The indicator forms lower highs
This suggests weakening buying momentum and a possible downward reversal.
Hidden Divergence
Hidden divergence often signals trend continuation.
Bullish Hidden Divergence
- Price forms higher lows
- The indicator forms lower lows
Bearish Hidden Divergence
- Price forms lower highs
- The indicator forms higher highs
These patterns indicate that the current trend is likely to continue.
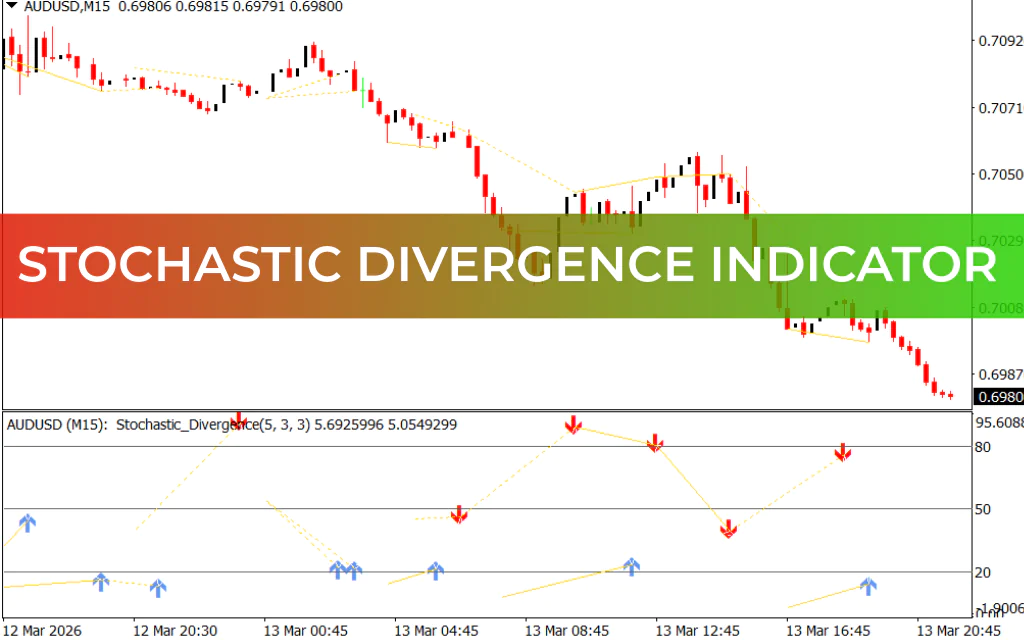
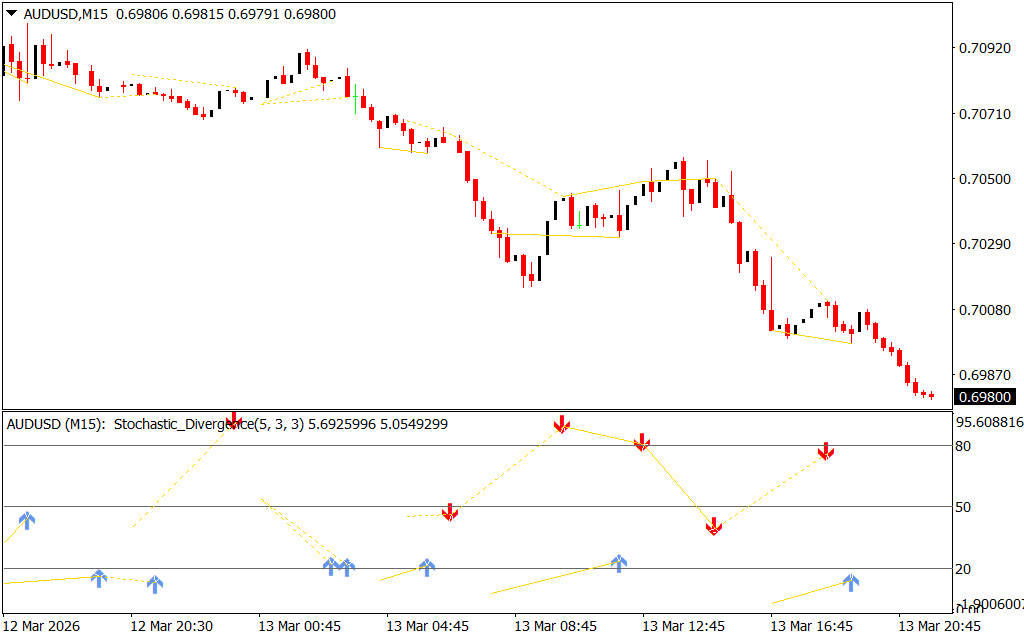
How the Stochastic Divergence Indicator Works
The Stochastic Divergence Indicator scans the market for divergence patterns on a selected timeframe.
Once detected, it provides visual signals on the chart.
Key features include:
- Blue arrows for bullish divergence signals
- Red arrows for bearish divergence signals
- Automatic divergence detection
- Real-time alerts and notifications
Traders can also receive signals through:
- On-screen alerts
- Email notifications
- Alert window messages
This ensures that traders never miss important divergence opportunities.
Adjustable Timeframe Analysis
One of the most useful features of the Stochastic Divergence Indicator is its ability to analyze divergences across different timeframes.
This allows traders to:
- Identify short-term trading opportunities
- Detect higher timeframe trend signals
- Find the best moment during the day to enter trades
Using multi-timeframe analysis can significantly improve the accuracy of divergence-based trading strategies.
Buy Signals
A buy signal appears when the indicator detects bullish divergence.
The indicator displays a blue arrow on the chart indicating a potential long opportunity.
Trading approach:
- Confirm that the market shows higher highs and higher lows.
- Enter a buy trade when the blue arrow appears.
- Place a stop loss below the previous swing low.
- Take profit when a counter signal appears or near resistance levels.
Sell Signals
A sell signal occurs when bearish divergence appears.
The indicator displays a red arrow indicating a potential short trade.
Trading approach:
- Look for lower highs and lower lows in price.
- Enter a sell position when the red arrow appears.
- Place a stop loss above the previous swing high.
- Take profit when a counter buy signal appears or near support levels.
How to Improve Divergence Trading Accuracy
Divergence signals can sometimes produce false signals. To improve accuracy, traders should always consider the overall market context.
Helpful tips include:
- Prefer buy signals in bullish markets
- Prefer sell signals in bearish markets
- Combine divergence signals with Support And Resistance levels
- Confirm signals using additional indicators or Price Action
For example:
- Buy signals near support zones
- Sell signals near resistance zones
These confirmations increase the probability of successful trades.
Key Features of the Stochastic Divergence Indicator
- Automatically detects regular and hidden divergences
- Works on multiple timeframes
- Displays clear buy and sell arrows
- Provides real-time alerts and notifications
- Does not repaint after signals appear
- Allows traders to analyze historical signals
Final Thoughts
The Stochastic Divergence Indicator for MT4 is a powerful tool for traders who want to identify divergence signals quickly and accurately. By automatically scanning the market and highlighting divergence patterns, the indicator saves time and helps traders focus on high-probability setups.
Although divergence signals can sometimes produce false entries, combining the indicator with support and resistance analysis, trend direction, and other technical tools can significantly improve trading results.
If you want to simplify divergence trading and capture potential trend reversals or continuations, the Stochastic Divergence Indicator is definitely worth adding to your MT4 trading toolkit.
FAQ
2 Downloads
Published:
Mar 15, 2026 10:54 AM
Category: