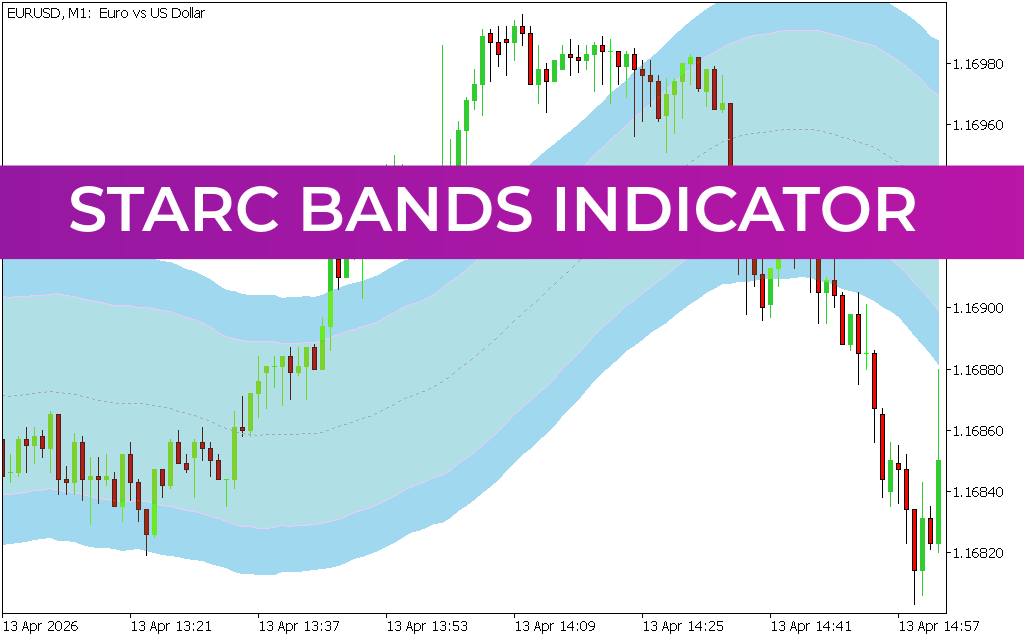
The Starc (Stoller Average Range Channels) Bands Indicator for MetaTrader 5 (MT5) is a powerful technical analysis tool designed to help traders identify trend reversals, overbought/oversold conditions, and high-probability entry points in the forex market.
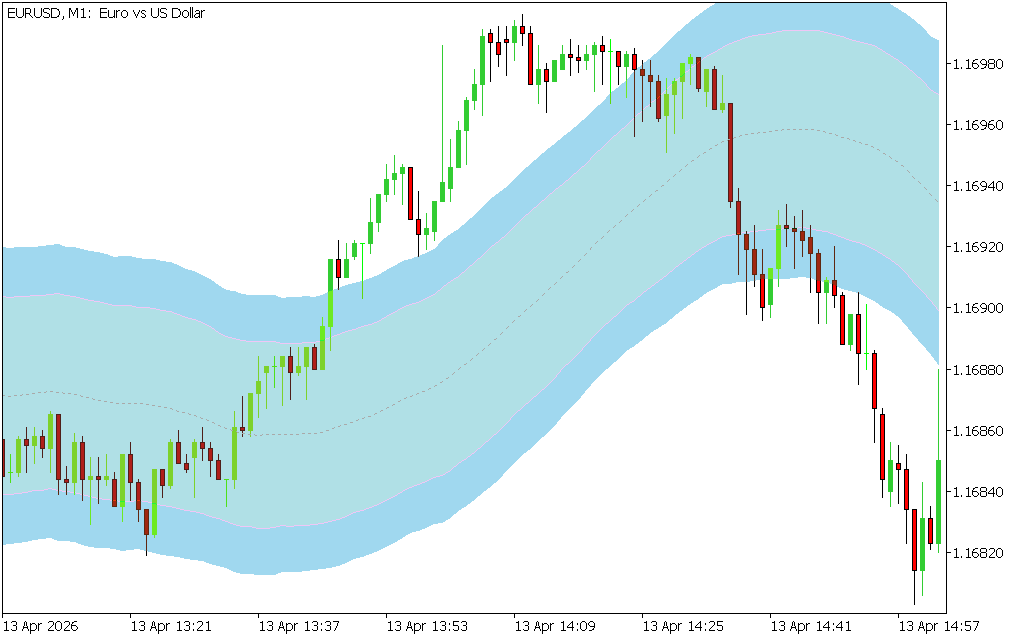
Similar in concept to Bollinger Bands, the Starc Bands indicator creates dynamic price channels that adjust based on market volatility, giving traders a clearer view of potential price extremes.
What Is the Starc Bands Indicator?
The Starc Bands Indicator is built using a combination of:
- Simple Moving Average (SMA) as the central trend line
- Average True Range (ATR) to measure volatility
- Upper and lower bands formed by adding/subtracting ATR from the SMA
This structure allows the indicator to create a flexible price channel that expands during high volatility and contracts during calm markets.
How the Starc Bands Indicator Works
The indicator plots three main components on the chart:
- 🔵 Upper Band: Potential resistance / overbought zone
- ⚪ Middle Line (SMA): Overall trend direction
- 🔴 Lower Band: Potential support / oversold zone
As volatility changes, the bands widen or tighten, helping traders understand current market pressure and possible price limits.
How to Trade Using Starc Bands
The Starc Bands Indicator is mainly used for reversal and range trading strategies.
Buy Signal (Long Entry)
A potential buy setup occurs when:
- Price touches or moves below the lower band
- A strong rejection candle (long wick) appears
- The next candle closes bullish (green)
Entry Strategy:
- Wait for price to test the lower band
- Look for rejection signals (wick formation)
- Enter long after bullish confirmation candle
- Use the middle SMA as a trend guide
Sell Signal (Short Entry)
A potential sell setup occurs when:
- Price touches or moves above the upper band
- A bearish rejection candle (long upper wick) forms
- The next candle closes bearish (red)
Entry Strategy:
- Wait for price rejection at the upper band
- Confirm with bearish candle close
- Enter short position after confirmation
- Use SMA line as dynamic resistance
Trend Direction Using Starc Bands
The middle SMA line helps identify market bias:
- Price above SMA → Bullish trend
- Price below SMA → Bearish trend
This makes it easier to align trades with overall market direction.
Best Trading Conditions
The Starc Bands Indicator performs best in:
- 📊 Scalping strategies (lower timeframes with caution)
- 📈 Intraday trading
- 📉 Swing trading setups
- 📊 Range-bound markets (best performance)
It is especially effective when combined with Price Action confirmation.
Key Advantages of Starc Bands Indicator
- Clearly identifies overbought and oversold zones
- Adapts automatically to market volatility
- Helps detect high-probability reversals
- Works across all forex pairs and timeframes
- Suitable for beginners and advanced traders
Important Trading Tips
To improve accuracy:
- Always wait for candlestick confirmation (not just band touch)
- Look for wick rejection signals at band edges
- Avoid trading during strong trending breakouts without confirmation
- Use higher timeframes for more reliable setups
Final Thoughts
The Starc Bands Indicator for MT5 is a highly effective volatility-based trading tool that helps traders identify potential reversal zones and trend direction with ease. By combining moving averages with ATR-based channel expansion, it provides a clear visual framework for analyzing market behavior.
While it can be used on its own, it becomes significantly more powerful when combined with price action strategies and proper risk management.
2 Downloads
Published:
Apr 13, 2026 12:17 PM
Category: