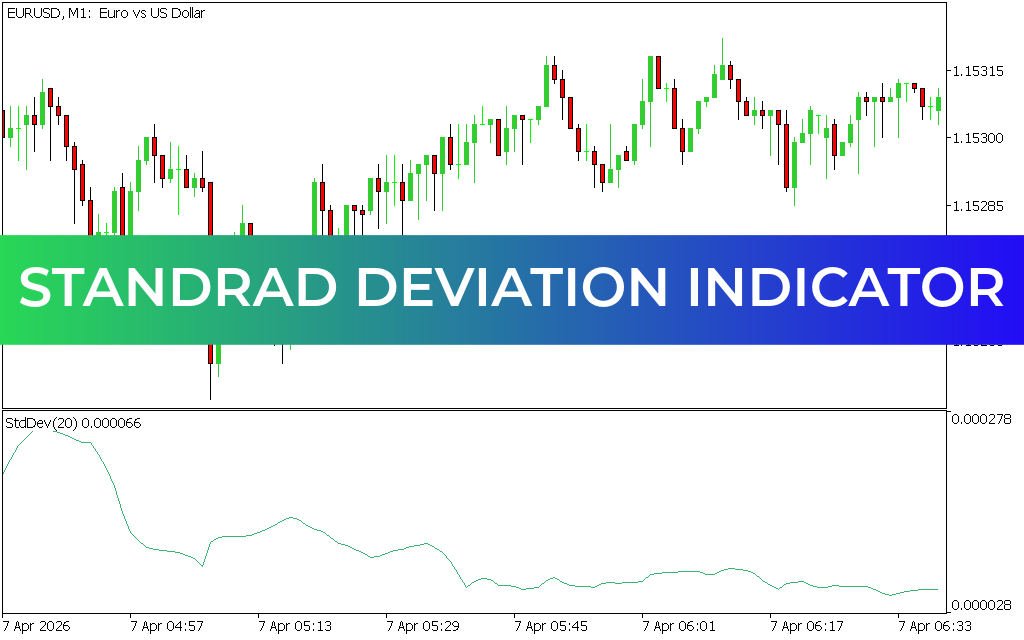
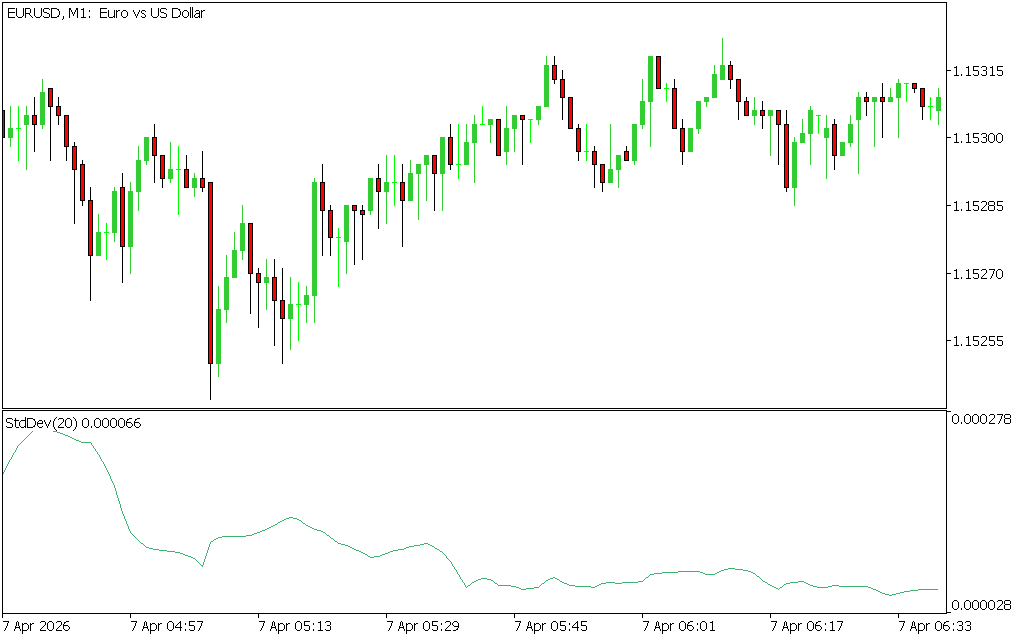
The Standard Deviation Indicator for MT5 is a statistical tool that measures market volatility relative to the simple moving average. Acting like an oscillator, it helps traders identify overbought and oversold conditions, trend direction, and potential reversals. Its simplicity and adaptability make it suitable for all timeframes, with higher timeframes offering more reliable signals.
Key Features
- Volatility Measurement: Shows how far price deviates from its average.
- Oscillator Line: Moves around zero, with greater distance indicating higher volatility.
- Overbought/Oversold Conditions: Helps traders spot potential reversal zones.
- Multi-Timeframe Use: Works across intraday, daily, weekly, and monthly charts.
- Flexible Application: Can be used as a trend filter, reversal detector, or breakout tool.
How to Trade with the Standard Deviation Indicator
- Trend Bias:
- Above zero = bullish trend.
- Below zero = bearish trend.
- Reversal Strategy:
- When the line hits the bottom, wait for it to turn upward and confirm with a bullish candle before entering long.
- When the line hits the top, wait for it to turn downward and confirm with a bearish candle before entering short.
- Breakout Strategy: Use sharp increases in deviation as signals of strong volatility and potential breakout opportunities.
Benefits for Traders
- Provides a clear measure of volatility.
- Helps identify trend direction and reversal zones.
- Easy to interpret for beginners, yet powerful for advanced traders.
- Works across multiple trading strategies including Scalping, day trading, and swing trading.
Conclusion
The Standard Deviation Indicator for MT5 is a versatile tool that can be used to filter trends, detect reversals, and spot breakouts. While it offers valuable insights into volatility, traders should always confirm signals with Price Action and backtest strategies for accuracy. Download it today to add statistical precision to your trading toolkit.
Published:
Apr 07, 2026 01:19 AM
Category: