In the forex market, every price movement is driven by the shifting balance between buyers and sellers. When demand dominates, price rises. When supply takes over, price falls.
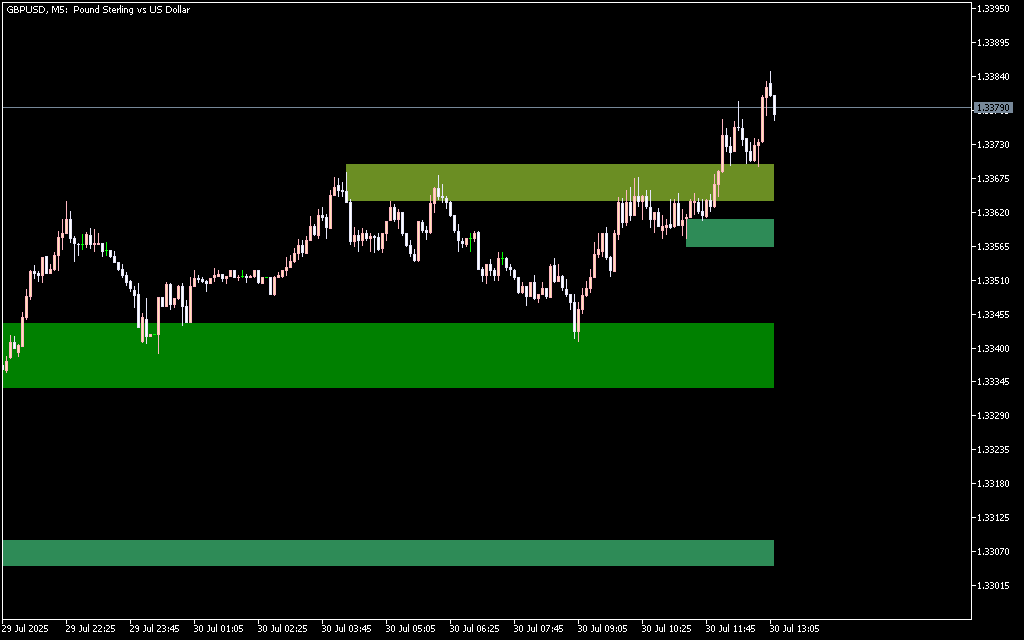
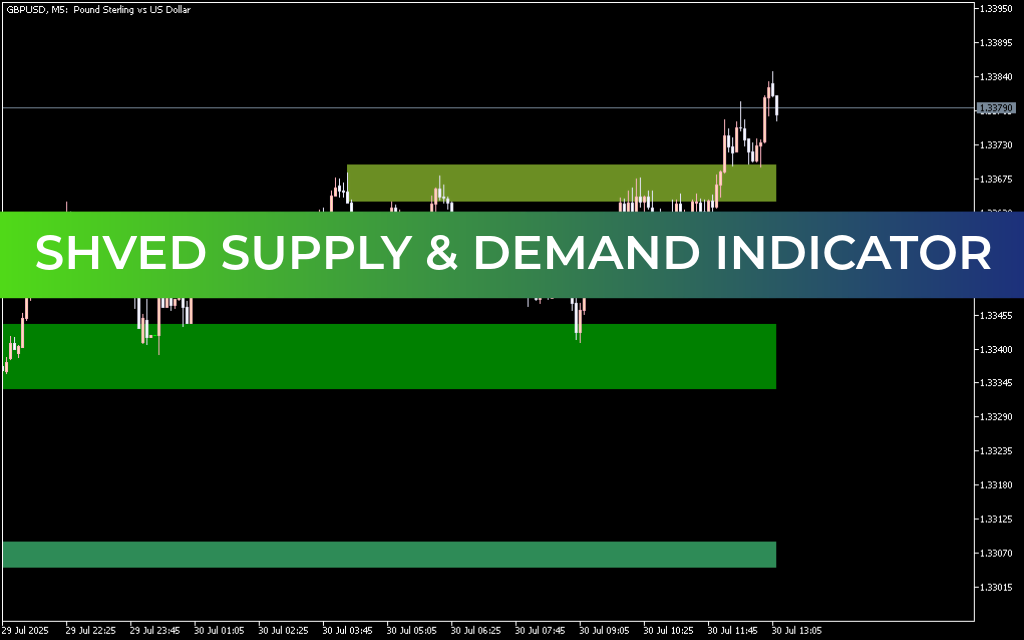
However, the standard MT5 platform does not include a built-in tool to highlight where these critical shifts occur. The Shved Supply & Demand Indicator for MT5 fills this gap by automatically identifying and drawing Supply And Demand zones directly on your chart.
This powerful and free indicator helps traders locate areas where price previously reacted strongly — making them potential high-probability entry and reversal zones.
What Is the Shved Supply & Demand Indicator?
The indicator detects key market zones where strong buying or selling activity occurred in the past. These areas often act as:
- Potential reversal zones
- High-interest trading levels
- Future support and resistance regions
The tool identifies zones based on strong directional moves that originated from them. If price previously reacted sharply from a level, the indicator marks it as an important area to watch.
Dynamic Zone Strength
The height of each zone reflects trading activity:
- Higher zone = stronger reaction history
- More price interaction = more reliable level
Each zone is labeled with a short description, making it easy to understand its significance at a glance.
Why Supply and Demand Zones Matter
Supply and demand zones represent areas where major market participants previously entered the market aggressively. When price revisits these levels, traders often react again — creating new trading opportunities.
Benefits include:
- Identifying potential reversal points
- Locating precise trade entries
- Improving risk-reward positioning
- Understanding institutional market activity
Higher timeframes generally provide more reliable zones because lower timeframes contain more market noise.
Types of Zones Identified by the Indicator
The Shved Supply & Demand Indicator classifies zones into five categories based on strength and market behavior.
1. Weak Zone
Minimal supply or demand imbalance.
Best to avoid trading or proceed cautiously.
2. Untested Zone
Price moved strongly from this level once but hasn’t returned yet.
Often considered high-interest areas for future reactions.
3. Verified Zone
Tested multiple times by price.
The indicator shows the number of retests — more retests mean stronger reliability.
4. Proven Zone
Highly active trading area repeatedly respected by the market.
These zones frequently trigger strong reactions until a breakout occurs.
5. Turncoat Zone (Mirror Level)
A former support becomes resistance or vice versa after a breakout.
These levels often provide powerful trading opportunities.
How to Trade with the Shved Supply & Demand Indicator
For best results, traders should not rely on zones alone. Instead, combine them with additional confirmation tools.
Recommended confirmations:
- Price Action signals
- Candlestick patterns
- Trend direction
- Momentum indicators
Typical approach:
- Identify strong supply or demand zone
- Wait for price to return
- Watch for confirmation signals
- Enter trade with stop loss beyond zone
The more times price previously reacted to a zone, the higher the probability of a meaningful response.
Key Advantages
- Automatically detects institutional trading zones
- Clearly labeled zone strength levels
- Helps identify high-probability entry points
- More reliable on higher timeframes
- Works with any trading strategy
- Completely free to download
Conclusion
The Shved Supply & Demand Indicator for MT5 is a powerful technical tool that automatically identifies areas of significant buying and selling pressure. By highlighting weak, tested, and proven zones, it helps traders understand where price is most likely to react.
Whether combined with price action, candlestick analysis, or other indicators, this tool significantly improves Market Structure analysis and trade planning. For traders seeking precision entries and stronger decision-making, it is an excellent addition to any MT5 trading setup.
FAQ
29 Downloads
Published:
Feb 27, 2026 14:43 PM
Category: