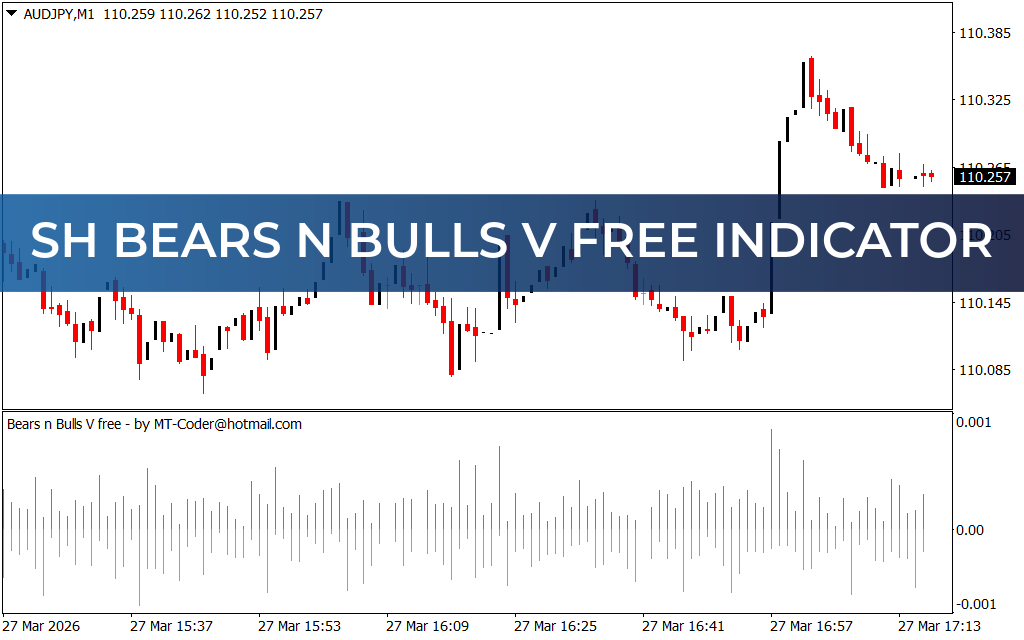
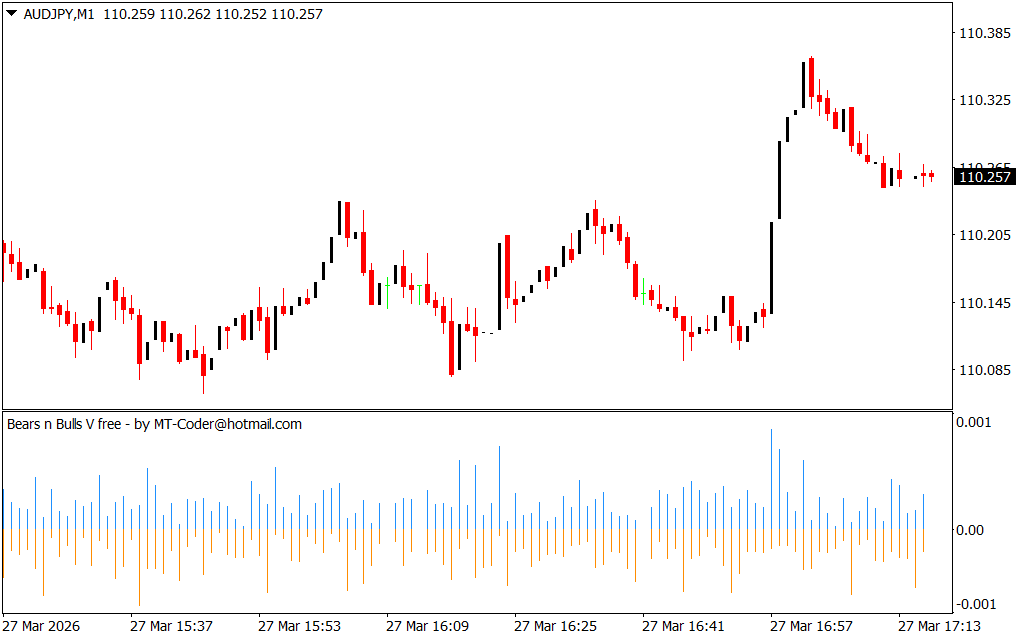
The SH Bears N Bulls V Free Indicator for MT4 is a powerful tool that visually represents the strength of buyers (bulls) and sellers (bears) using a histogram. By clearly displaying market dominance, this indicator helps traders align their strategies with prevailing market sentiment and make more informed trading decisions.
With its simple and intuitive design, the indicator is suitable for both beginner and advanced forex traders. It works effectively across all timeframes—from intraday charts to daily, weekly, and monthly—making it a versatile addition to any trading setup.
SH Bears N Bulls Indicator Trading Signals
The indicator plots histogram bars with a ZERO line:
- Blue Bars: Represent bullish strength (buyers in control)
- Red Bars: Represent bearish strength (sellers in control)
Trading Strategy:
- Buy Signal:
- Enter a buy trade when blue bars (bulls) dominate
- Place a stop-loss below the previous swing low
- Sell Signal:
- Enter a sell trade when red bars (bears) dominate
- Place a stop-loss above the previous swing high
- Reversal Signals:
- Sudden spikes in strength may indicate potential trend reversals
- For example, a strong bullish spike during a downtrend may signal a possible upward reversal
- Exit Strategy:
- Close trades when the opposite side (bulls or bears) gains dominance
This approach allows traders to follow market momentum while staying alert to potential reversals.
Why Use the SH Bears N Bulls Indicator?
- Clearly visualizes buyer and seller strength
- Helps traders align with market sentiment
- Identifies potential trend reversals through strength spikes
- Works across all timeframes and trading styles
The SH Bears N Bulls V Free Indicator for MT4 is an essential tool for traders who want to understand market dynamics and trade with confidence by following the dominant market force.
Download the SH Bears N Bulls V Free Indicator for MT4 today and trade smarter by following real-time buyer and seller strength!
FAQ
Published:
Mar 27, 2026 12:19 PM
Category: