The RSI Inverse Fisher Transform Indicator for MetaTrader 5 (MT5) is a powerful technical analysis tool that combines moving averages, Relative Strength Index (RSI), and Fisher Transform smoothing to generate high-quality trading signals.
By refining RSI readings through statistical transformation, this indicator helps traders identify strong overbought and oversold conditions, improving the timing of potential buy and sell entries.
What Is the RSI Inverse Fisher Transform Indicator?
This indicator enhances traditional RSI analysis by applying two key processes:
- Price smoothing using a moving average
- Fisher Transform applied to RSI values
The result is a more responsive and clearer oscillator that helps traders spot potential market reversals earlier and more accurately.
It is suitable for all forex trading styles, including:
- Intraday trading
- Swing trading
- Long-term position trading
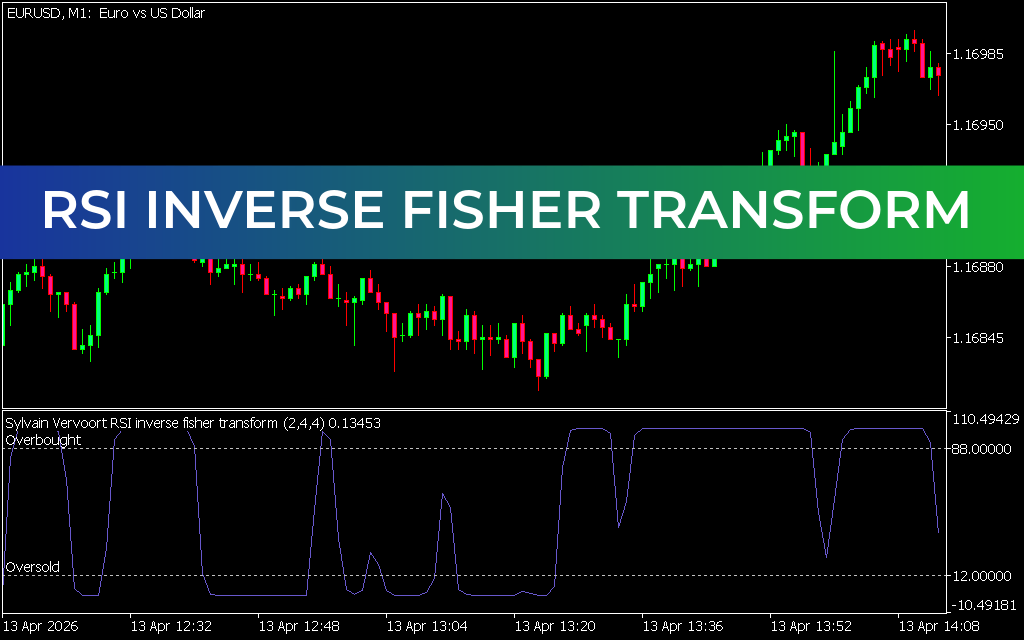
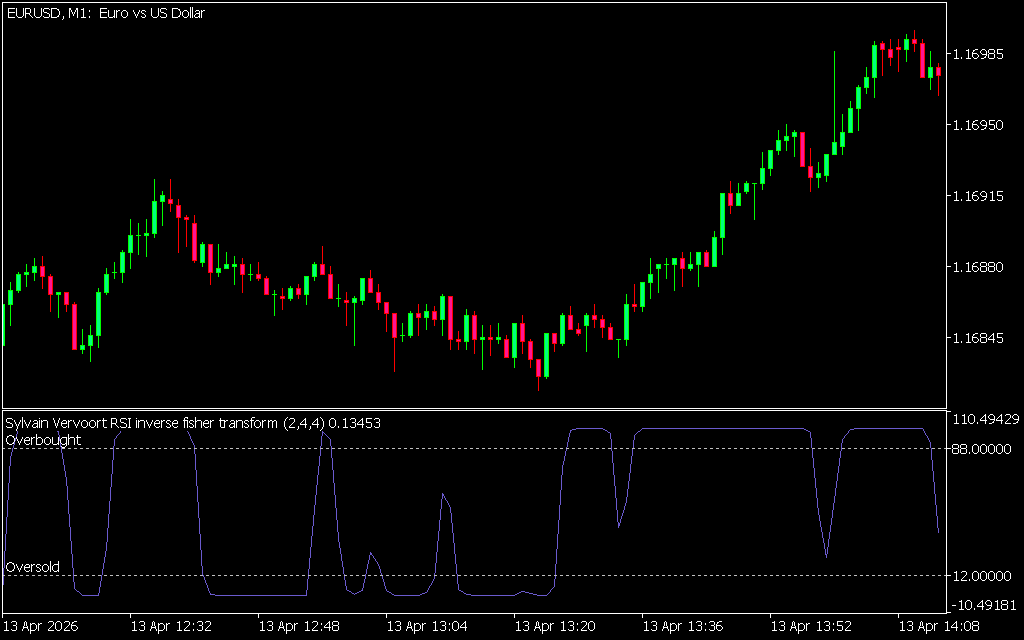
How the RSI Inverse Fisher Transform Works
The indicator displays RSI-based momentum in a transformed oscillator window with color-coded zones:
- 🔴 Red zone: Overbought conditions
- 🔵 Blue zone: Oversold conditions
- ⚪ Gray zone: Neutral / transition area
This makes it easier for traders to interpret market sentiment at a glance.
Buy Signal (Long Entry)
A potential buy opportunity occurs when:
- The oscillator moves from blue (oversold) into gray (neutral zone)
- Market shows signs of upward momentum
- Confirmation appears after color shift
Entry Strategy:
- Wait for oscillator to leave oversold (blue) zone
- Enter BUY when color changes to gray
- Place stop-loss below the previous swing low
- Use a 1:2 risk-to-reward ratio or higher for exits
Sell Signal (Short Entry)
A potential sell opportunity occurs when:
- The oscillator moves from red (overbought) into gray (neutral zone)
- Market shows weakening bullish momentum
- Downward reversal begins forming
Entry Strategy:
- Wait for color transition from red to gray
- Enter SELL after confirmation
- Place stop-loss above recent swing high
- Exit at strong R:R levels or opposite signal
Multi-Timeframe Trading Capability
One of the strongest features of this indicator is its multi-timeframe (MTF) compatibility.
Traders can:
- Apply higher timeframe RSI signals on lower charts
- Combine daily, H4, and H1 analysis
- Build stronger confirmation-based strategies
This improves accuracy and reduces false signals.
Best Trading Conditions
The RSI Inverse Fisher Transform Indicator works best in:
- 📊 Trending markets (pullback entries)
- 📉 Reversal trading setups
- 📈 Swing trading strategies
- ⏱ Intraday forex trading
It is suitable for both beginners and advanced traders.
Advantages of RSI Inverse Fisher Transform Indicator
- Provides smoother and more accurate RSI signals
- Clearly identifies overbought and oversold zones
- Reduces noise compared to standard RSI
- Works across all timeframes and forex pairs
- Supports multi-timeframe analysis
- Easy-to-use visual color system
Trading Tips for Better Results
To improve performance:
- Always wait for color confirmation (red/blue → gray transition)
- Combine with support and resistance levels
- Avoid trading during strong news spikes without confirmation
- Use higher timeframe trends for direction bias
Final Thoughts
The RSI Inverse Fisher Transform Indicator for MT5 is an advanced momentum tool that enhances traditional RSI analysis by filtering noise and improving signal clarity. Its combination of smoothing techniques and Fisher transformation helps traders better identify reliable entry and exit points.
While powerful on its own, it performs best when combined with trend analysis, Price Action, and proper risk management strategies.
4 Downloads
Published:
Apr 13, 2026 12:23 PM
Category: