The RSI Bands Indicator for MT4 is a powerful custom trading tool designed to detect overbought and oversold market conditions while also generating potential buy and sell signals. Unlike the standard Relative Strength Index, which only identifies overbought and oversold levels, the RSI Bands indicator adds dynamic bands directly on the price chart to provide clearer trading signals.
By combining RSI analysis with visual price bands, this indicator helps traders identify possible trend reversals and entry points more easily on the MetaTrader 4 trading platform.
How the RSI Bands Indicator Works
The traditional RSI indicator measures market momentum and signals extreme market conditions:
- RSI above 70 → Overbought market
- RSI below 30 → Oversold market
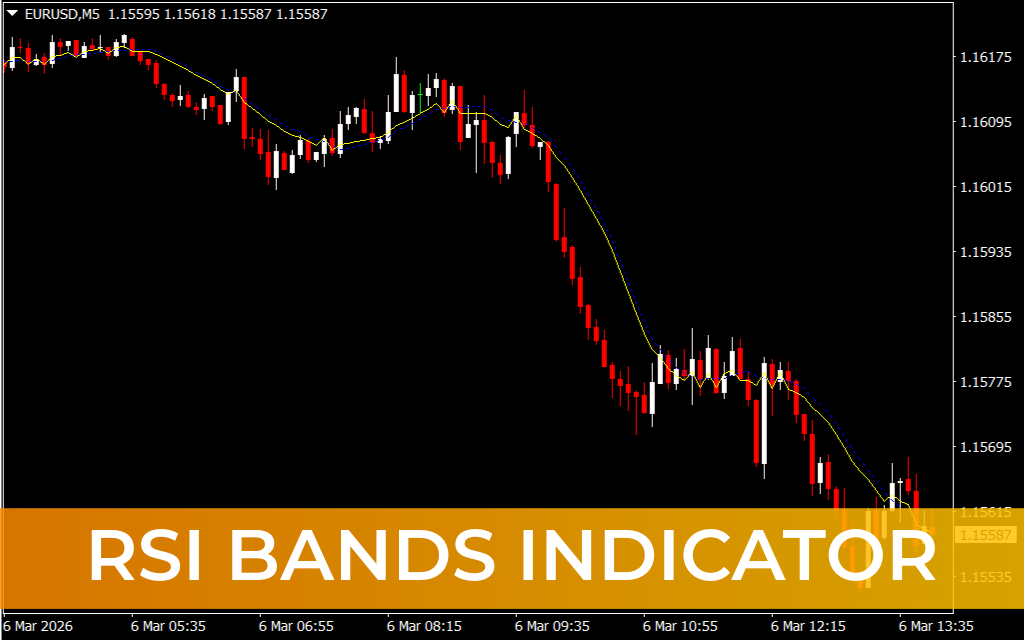
However, the RSI Bands Indicator enhances this concept by plotting two dynamic lines directly on the price chart:
- Blue Dotted Line
- Yellow Signal Line
These bands move with Price Action and help determine when the market reaches extreme conditions.
Signal Interpretation
Overbought Signal (Potential Sell Setup)
- The yellow line crosses below the blue dotted line
- Price closes below the bands
- Suggests a possible bearish reversal
Oversold Signal (Potential Buy Setup)
- The yellow line crosses above the blue dotted line
- Price closes above the bands
- Indicates a possible bullish reversal
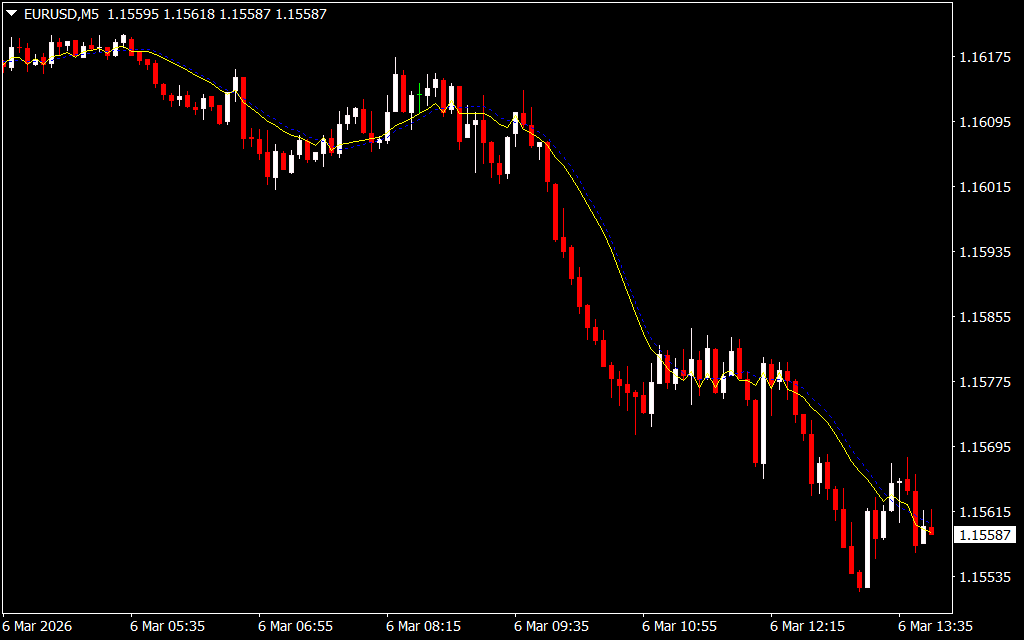
Example Trading Setup
Consider an example on the **EUR/USD currency pair in the M30 timeframe.
- The yellow and blue RSI band lines cross each other
- The crossover indicates a potential overbought condition
- The price closes below the indicator bands
- A supply zone forms and price retests it
- A bearish candlestick confirms the sell signal
This combination of indicator crossover and price action confirmation provides a high-probability trade setup.
Best Way to Use the RSI Bands Indicator
Although the RSI Bands Indicator can generate trading signals, it works best when combined with additional technical analysis tools.
Recommended confirmations include:
- Support And Resistance zones
- Supply And Demand levels
- Candlestick patterns
- Trend analysis
Using these confirmations can help traders filter false signals and improve trade accuracy.
Key Features of the RSI Bands Indicator
- Detects overbought and oversold conditions
- Generates buy and sell entry signals
- Displays dynamic bands on the price chart
- Enhances traditional RSI analysis
- Works on multiple timeframes
- Suitable for Scalping, intraday, and swing trading
Who Should Use This Indicator?
The RSI Bands Indicator is ideal for traders who want to combine momentum analysis with price-based signals. It is commonly used by:
- Scalpers looking for quick reversal signals
- Day traders identifying intraday turning points
- Swing traders capturing larger market reversals
Conclusion
The RSI Bands Indicator for MT4 is a dynamic trading tool that improves traditional RSI analysis by adding visual bands and crossover signals directly to the chart. This allows traders to easily identify overbought and oversold zones, as well as potential trend reversals.
When combined with price action and proper risk management, the RSI Bands Indicator can become a valuable tool for improving technical analysis and trading decisions.
FAQ
1 Download
Published:
Mar 06, 2026 07:58 AM
Category: