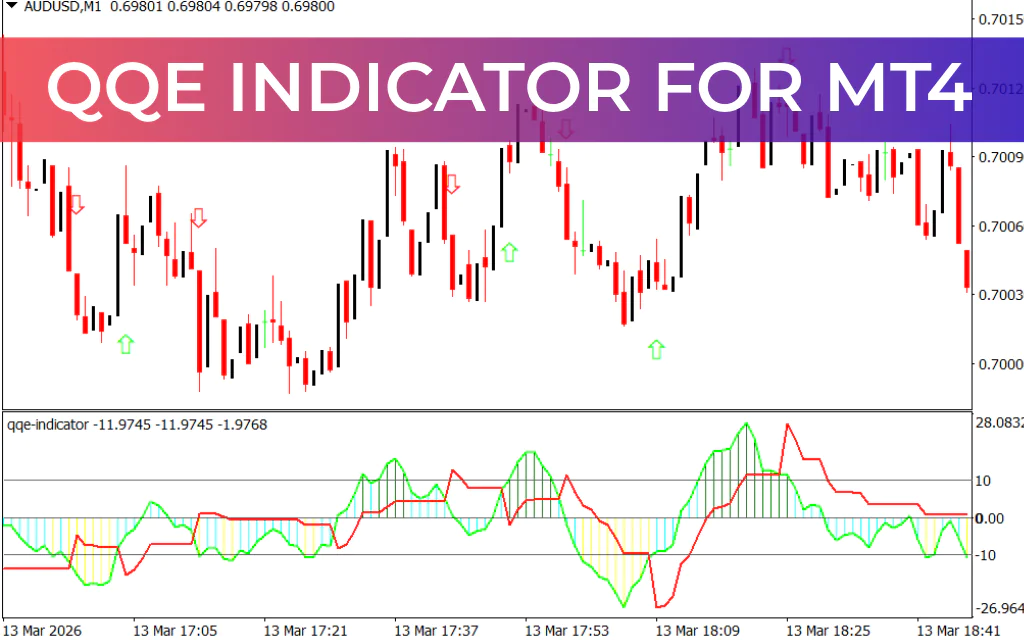
The QQE (Qualitative Quantitative Estimation) Indicator is a powerful momentum and trend analysis tool derived from the Relative Strength Index (RSI) with advanced smoothing techniques. This enhancement reduces noise and lag while maintaining responsiveness to market movements.
The QQE indicator has remained reliable across changing market conditions and volatility levels, even after major market events like the 2008 global financial crisis. Because of its stability and accuracy, traders often use it to identify trend direction, overbought/oversold conditions, and momentum divergence.
Key Features
- RSI-Based with Advanced Smoothing – Provides clearer signals with reduced noise.
- Trend Identification – Uses the 50-level as a trend filter.
- Overbought/Oversold Detection – Highlights potential reversal zones.
- Momentum Crossovers – Uses fast and trailing lines to detect shifts in momentum.
- Divergence Detection – Helps anticipate potential market reversals.
How to Use the QQE Indicator
1. Trend Trading
The 50-level acts as a trend filter:
- Above 50 → Bullish market → Look for BUY opportunities.
- Below 50 → Bearish market → Look for SELL opportunities.
This simple rule allows traders to avoid trading against the dominant trend.
2. Overbought and Oversold Levels
The QQE also identifies extreme market conditions:
- Above 70 → Strong bullish momentum (potential continuation or reversal).
- Below 30 → Oversold market, possible bullish reversal.
These levels help traders anticipate potential turning points.
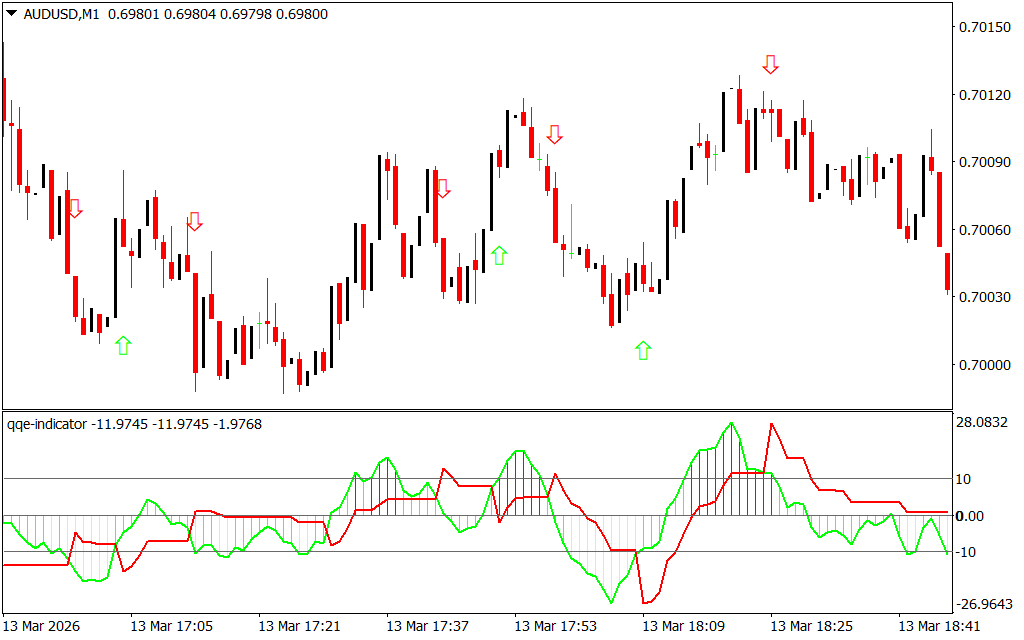
3. Momentum Crossovers
The QQE contains two lines:
- Fast line (smoothed RSI)
- Trailing slow line
Signals occur when these lines cross:
- Fast line crosses above slow line → Bullish momentum → BUY signal.
- Fast line crosses below slow line → Bearish momentum → SELL signal.
These crossovers often precede strong trend movements.
4. Divergence Trading
The QQE can detect momentum divergence between price and the indicator.
Bullish Divergence
- Price forms lower lows
- QQE forms higher lows
- Possible uptrend reversal
Bearish Divergence
- Price forms higher highs
- QQE forms lower highs
- Possible downtrend reversal
Divergences are often early warnings of market turning points.
Example
On a EUR/USD daily chart:
- The green QQE line moves closely with price direction.
- When it crosses above the red trailing line, bullish momentum starts.
- When it crosses below the trailing line, a bearish trend begins.
- Reversals often occur when the indicator reaches overbought or oversold zones.
These signals allow traders to enter trades early in emerging trends.
Advantages
- Smooth and responsive signals
- Reliable across different market conditions
- Useful for trend trading, reversals, and divergence strategies
- Works on all timeframes and instruments
Conclusion
The QQE Indicator for MT4 is a versatile momentum tool that combines trend filtering, crossover signals, and divergence detection in a single indicator. Its ability to smooth RSI data while maintaining responsiveness makes it a valuable addition to any trading strategy. By combining QQE signals with price action or Support And Resistance levels, traders can significantly improve their trade timing and accuracy.
FAQ
7 Downloads
Published:
Mar 14, 2026 18:51 PM
Category: