The Price Channel Indicator for MetaTrader 5 is a versatile tool designed to help Forex traders identify key support and resistance levels while visualizing price activity in a higher timeframe context. By building a channel from H4 price data and displaying it on lower timeframes, it allows day traders and short-term traders to enter trades with improved accuracy.
Suitable for beginners and experienced traders, this indicator works on all timeframes below H4, making it ideal for intraday analysis and short-term trading strategies.
How the Price Channel Indicator Works
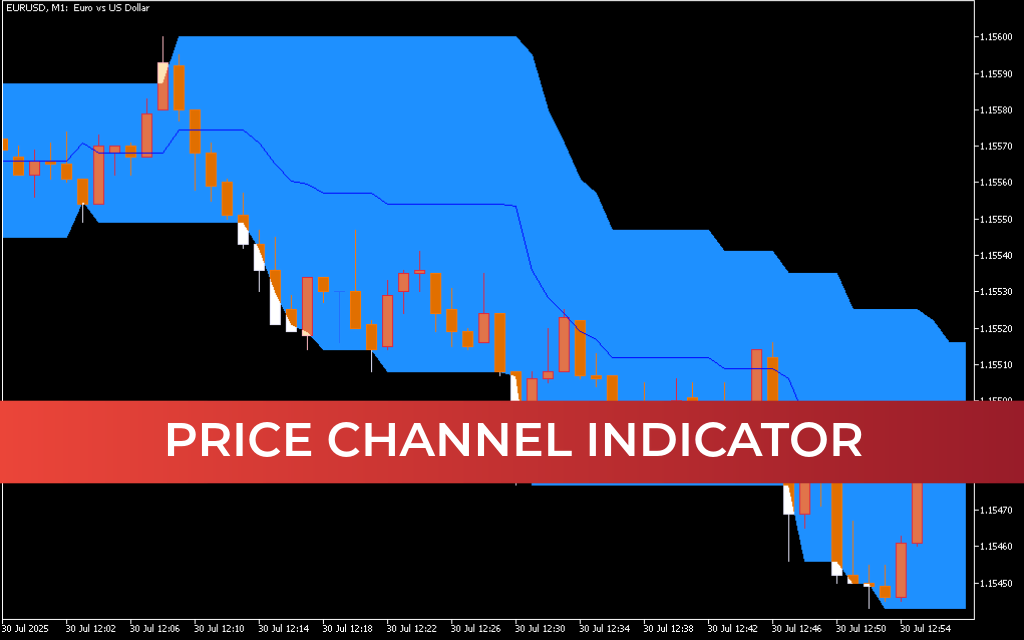
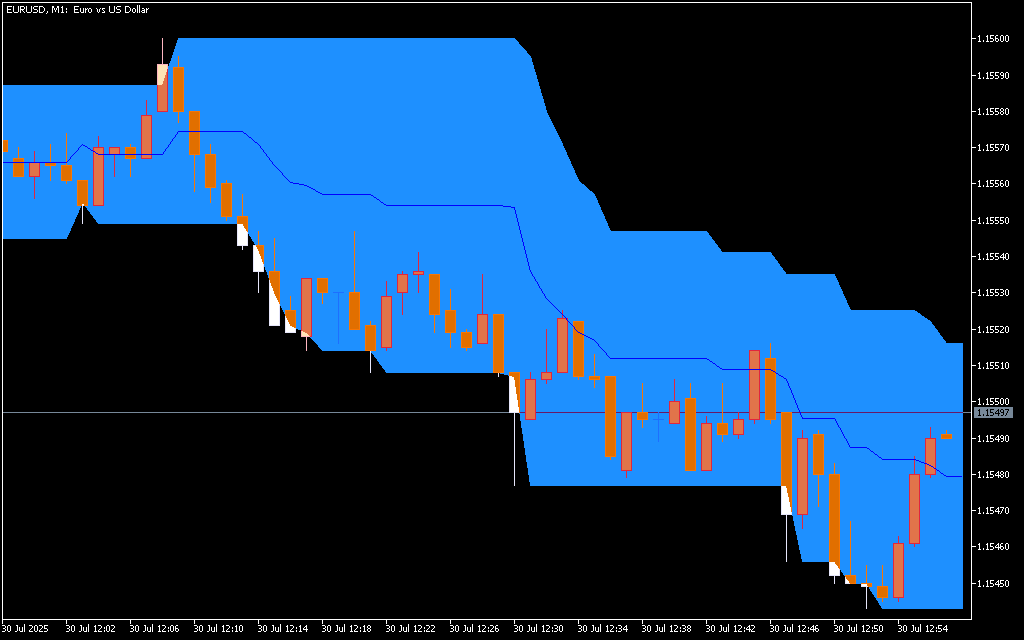
The indicator displays:
- Histogram & Channel Zones:
- Blue line: Represents the top of trading activity.
- Light blue and gray zones: Highlight areas where 60% of trades occur.
- Dotted lines: Mark zones where 90% of trades take place, indicating high liquidity and potential reversal areas.
- Support & Resistance Levels:
- Automatically plotted to guide intraday entries and exits.
- Provide visual cues for trend continuation or reversal trades.
Trading Strategy:
- Bullish Signal:
- Price moves above the blue line.
- Enter buy trades near support or after confirming a reversal above the red line.
- Stop loss: below previous swing low.
- Take profit: when opposite signals appear or near resistance levels.
- Bearish Signal:
- Price moves below the red line.
- Enter short trades near resistance or after a confirmed reversal below the red line.
- Stop loss: above previous swing high.
- Take profit: when bullish signals appear or near support levels.
- Reversal Trading:
- Watch for price reaching extremes above or below the histogram for potential pullbacks.
Key Features
- Higher Timeframe Data: Channels built from H4 data displayed on lower timeframes.
- Histogram Visualization: Highlights where most trades occur, aiding liquidity-based decisions.
- Support & Resistance Lines: Automatic plotting for accurate intraday entry and exit points.
- Trend & Reversal Signals: Price relative to channel lines indicates bullish or bearish conditions.
- User-Friendly: Works out-of-the-box with clear visual zones.
- Scalping & Short-Term Trading Friendly: Ideal for M1–H1 intraday charts.
Why Traders Use the Price Channel Indicator
- Identify intraday support and resistance levels from a higher timeframe perspective.
- Spot high-probability reversal zones using histogram extremes.
- Improve entry timing for both bullish and bearish trades.
- Use channel zones to guide stop loss and take profit placement.
- Avoid relying on multiple indicators—channel and histogram provide actionable insights on their own.
By combining higher timeframe data with intraday visualization, the Price Channel Indicator gives traders a clear edge in both trend-following and reversal strategies.
Conclusion
The Price Channel Indicator for MT5 provides a simple yet powerful way to track Forex price movement and trading activity. With its higher timeframe channel, histogram of trade density, and automatically plotted support/resistance lines, it helps traders make informed decisions for intraday and short-term trades. This indicator is ideal for Forex day traders looking for clarity, precision, and actionable trading signals.
FAQ
Published:
Mar 04, 2026 11:17 AM
Category: