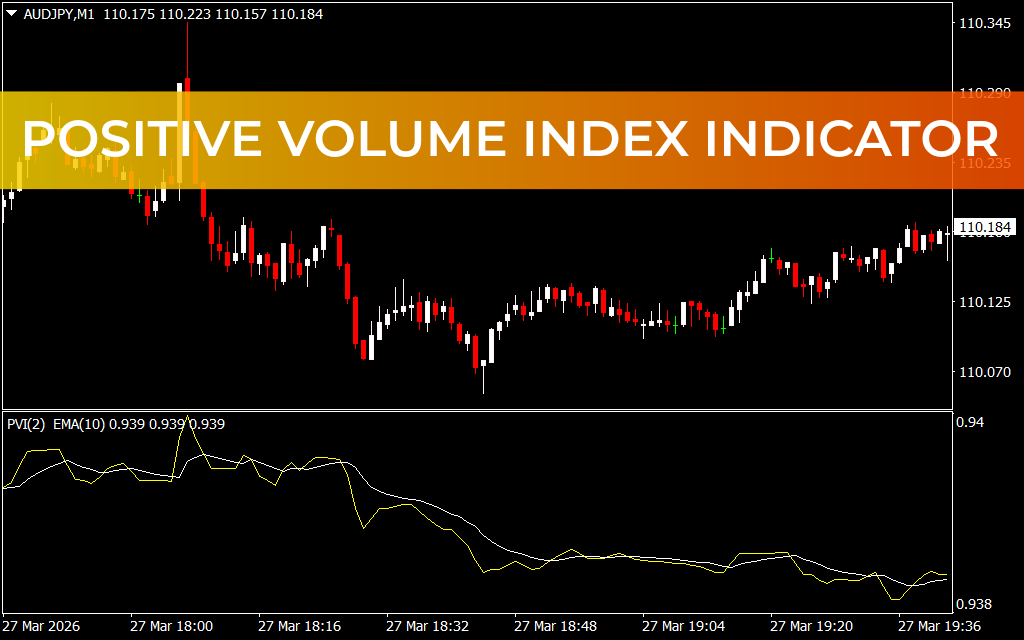
The Positive Volume Index (PVI) Indicator for MetaTrader 4 (MT4) is an oscillator that helps traders identify overbought and oversold conditions in the market. By analyzing price movements relative to volume, the indicator provides clear signals for potential buy or sell opportunities.
What Is the Positive Volume Index Indicator?
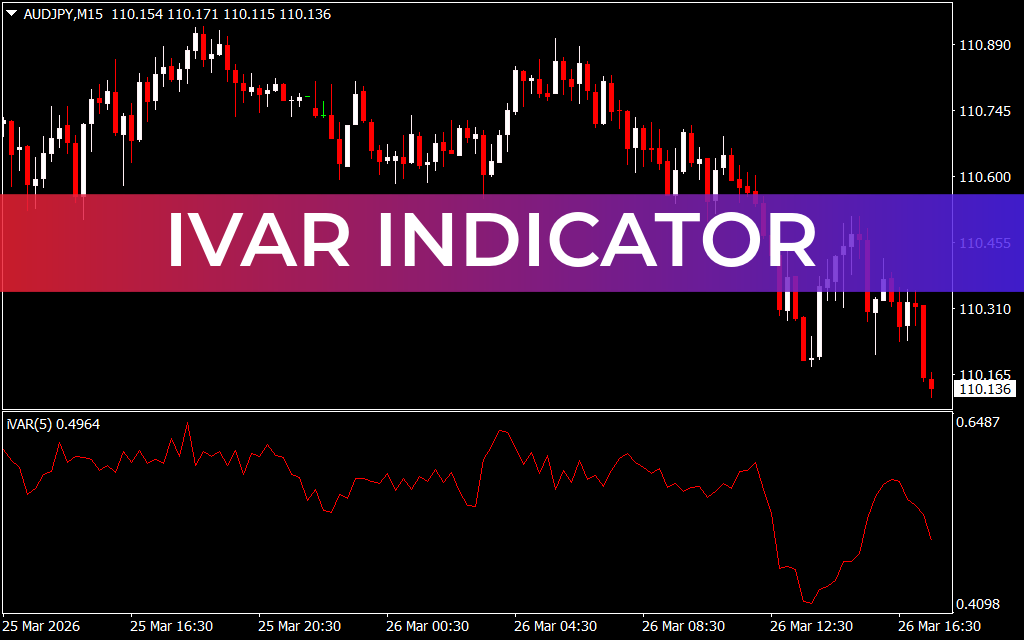
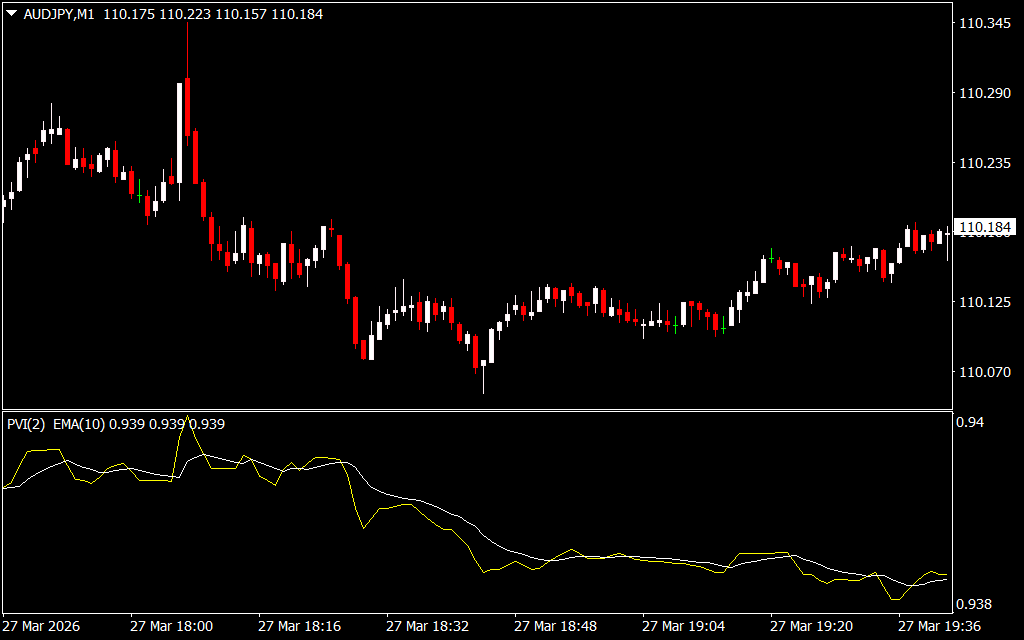
The PVI Indicator works by plotting the Exponential Moving Average (EMA) of period-10 as an oscillator:
- Upper Level (Overbought): Signals potential market exhaustion; ideal for short positions or exiting long trades
- Lower Level (Oversold): Signals market support; ideal for long positions
It is most effective on longer timeframes, as shorter timeframes may generate false signals due to market noise.
How to Use the PVI Indicator in MT4
- Identify Overbought and Oversold Zones:
- Overbought: EMA signal line approaches the upper level → consider selling or closing long positions
- Oversold: EMA signal line approaches the lower level → consider buying or entering long positions
- Combine with Other Indicators:
- Use with Moving Averages, RSI, or MACD for additional confirmation
- Helps filter out false signals and improve trade accuracy
- Trading Example:
- On a GBP/USD H4 chart, the EMA line approaches the upper level → trader enters a short position
- When the EMA approaches the lower level → trader enters a long position
Key Benefits
- Clearly indicates overbought and oversold conditions
- Provides actionable buy and sell signals
- Works on all MT4-compatible instruments
- Easy to interpret for beginners and advanced traders
- Free and lightweight
Conclusion
The Positive Volume Index Indicator for MT4 is a simple yet powerful tool for spotting overbought and oversold market conditions. It allows traders to enter long or short positions with better timing and can be combined with other indicators for improved trade confirmation.
FAQ
1 Download
Published:
Mar 28, 2026 19:18 PM
Category: