The Point & Figure v1.2 Indicator for MT4 is a technical trading tool inspired by the traditional Point and Figure charting method. Unlike standard candlestick charts, this indicator focuses purely on price movement and filters out minor market noise to help traders identify the true direction of the trend.
Instead of displaying candles, the Point & Figure system uses columns of Xs and Os to represent upward and downward price movement. The MT4 version simplifies this concept by displaying colored bars and support/resistance levels below the main chart window.
This makes it easier for traders to quickly understand market momentum and potential trading opportunities.
What Is the Point & Figure v1.2 Indicator?
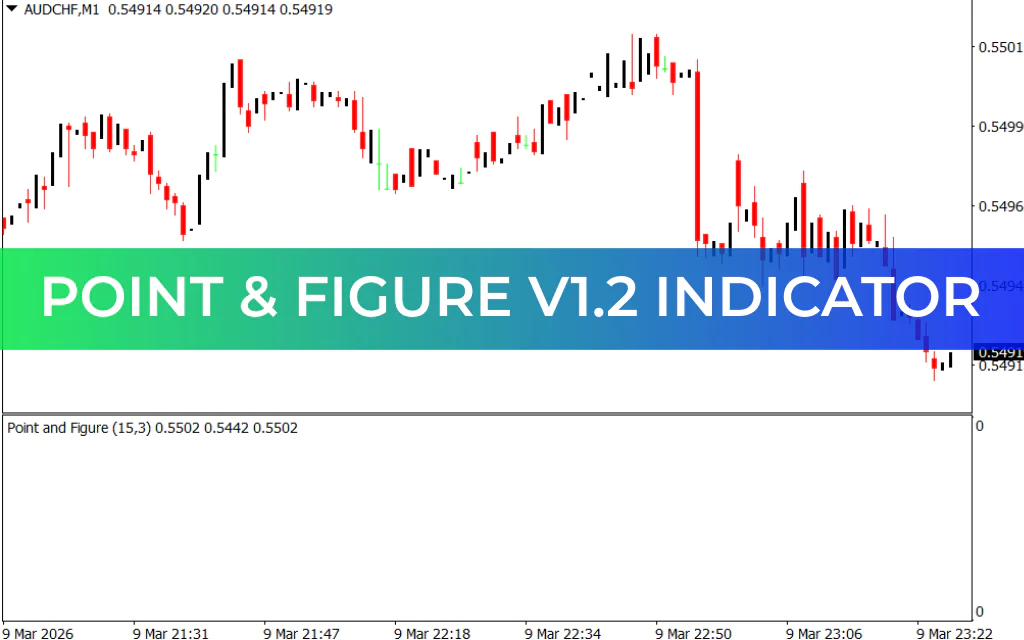
The Point & Figure v1.2 Indicator applies the classic Point & Figure trading logic to the MetaTrader 4 platform. It analyzes price action and displays:
- Green and White columns to show trend direction
- Red bars to highlight support levels
- Blue bars to mark resistance levels
These visual elements help traders determine where the market may reverse or continue trending.
Key Features of the Point & Figure v1.2 Indicator
This indicator offers several useful features for forex traders:
- Identifies trend direction using simplified columns
- Highlights key Support And Resistance levels
- Filters out minor market noise
- Provides clear BUY and SELL signals
- Works well with trend-following strategies
Because of its structured approach, the indicator helps traders focus on significant price movements instead of short-term fluctuations.
Best Timeframes to Use the Indicator
The Point & Figure v1.2 Indicator performs best on higher timeframes, such as:
- H1
- H4
- Daily charts
Using the indicator on very short timeframes may produce false signals, so longer timeframes are generally recommended for more reliable analysis.
Point & Figure v1.2 Indicator BUY Signal
To identify a BUY opportunity, traders can look for the following conditions:
- The indicator draws red bars, which represent support levels.
- Price reacts near the support zone.
- White columns appear, indicating upward momentum.
When these conditions occur, traders may consider opening a BUY/LONG position, expecting the price to move upward.
Point & Figure v1.2 Indicator SELL Signal
To identify a SELL opportunity, traders should look for these signals:
- The indicator plots blue bars, which represent resistance levels.
- Price approaches or rejects the resistance zone.
- Green columns appear, indicating downward momentum.
These conditions suggest that the market may move lower, giving traders a potential SELL/SHORT opportunity.
What Is a Point & Figure Buy Signal?
A Point & Figure buy signal occurs when the indicator detects strong upward price movement and highlights support levels that suggest a possible bullish continuation.
In simple terms, when the indicator identifies support combined with bullish momentum, it indicates a buying opportunity.
Does the Point & Figure Indicator Work?
Yes, the Point & Figure v1.2 Indicator is considered a reliable tool for identifying market trends and important price levels. Traders typically use it in two main ways:
- By analyzing support and resistance levels
- By observing green and white momentum bars
When used correctly, the indicator can help traders identify clear market direction and reduce trading noise.
Improve Accuracy with Other Indicators
To increase signal reliability, traders often combine the Point & Figure v1.2 Indicator with other technical tools such as:
- RSI (Relative Strength Index)
- MACD
- Moving Averages
- Price Action Analysis
Combining indicators can help traders confirm signals and avoid false entries.
Conclusion
The Point & Figure v1.2 Indicator for MT4 is a useful tool for traders who want to identify trend direction and key support and resistance levels while filtering out minor price fluctuations.
By analyzing momentum bars and important price zones, traders can better understand the market and locate high-probability BUY and SELL opportunities.
You can download the Point & Figure v1.2 Indicator for MT4 for free and start using it to improve your trading strategy and market analysis.
FAQ
Published:
Mar 09, 2026 18:27 PM
Category: