The Perfect Trendline Indicator for MT5 is a powerful yet easy-to-use technical tool designed to help traders identify market trends and generate precise buy and sell signals. Built with simplicity and efficiency in mind, this indicator uses a dual trendline system combined with visual dot signals to guide trading decisions.
How the Perfect Trendline Indicator Works
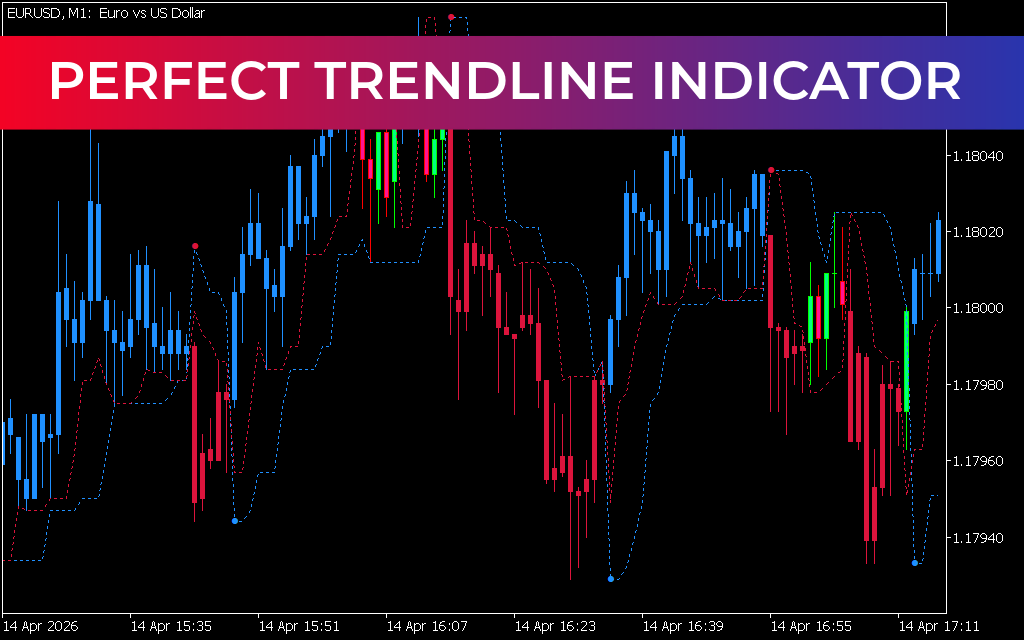
The indicator consists of two trendlines:
- Fast Trendline – reacts quickly to price movements
- Slow Trendline – filters noise and confirms the overall trend
These lines work together to define clear BUY and SELL signals, making it easier for traders to understand market direction.
In addition to trendlines, the indicator plots colored dots on the chart:
- Blue Dot – Indicates a BUY signal
- Red Dot – Indicates a SELL signal
These dots also act as entry and exit points, helping traders time their trades more effectively.
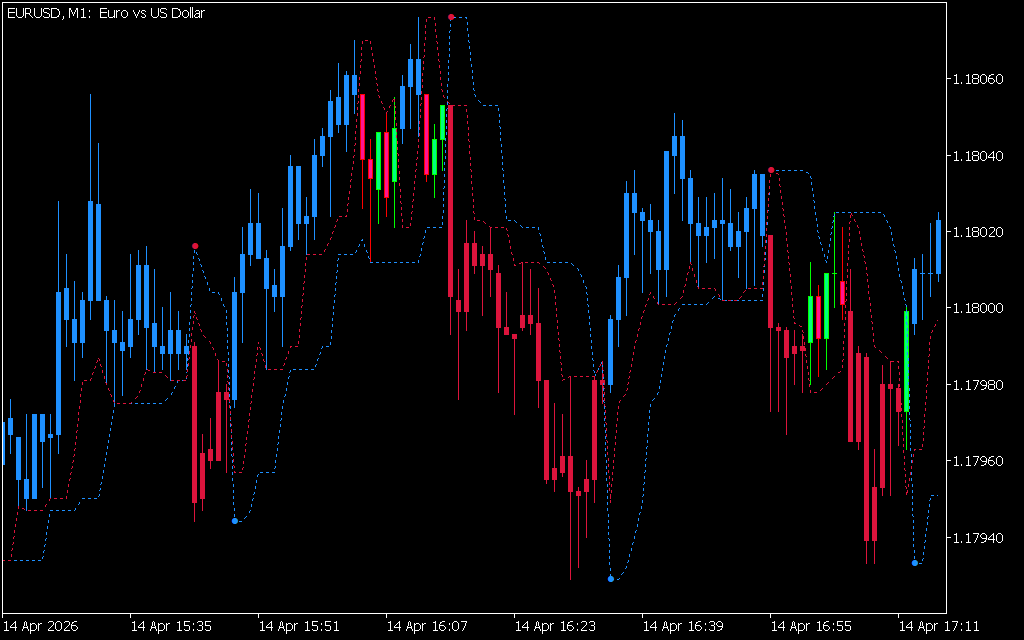
Visual Candle Confirmation
To enhance clarity, the Perfect Trendline Indicator also colors traditional candlesticks:
- Blue Candles – Bullish momentum
- Red Candles – Bearish momentum
- Neutral Candles – No clear trend
This visual aid allows traders to quickly assess market sentiment without additional analysis.
Best Timeframes for Accurate Signals
While the indicator works across multiple timeframes, it performs best on higher timeframes such as:
- H4 (4-hour)
- Daily charts
Using it on lower timeframes may result in false signals, so traders are advised to focus on longer-term analysis for improved accuracy.
Perfect Trendline Indicator BUY & SELL Strategy
Buy Signal (Long Position)
To enter a BUY trade, traders should look for:
- A Blue dot appearing on the chart
- The Blue trendline crossing above the Red trendline
This combination confirms bullish momentum and a potential upward trend.
Sell Signal (Short Position)
To open a SELL trade, traders should watch for:
- A Red dot appearing
- The Red trendline crossing above the Blue trendline
This indicates bearish momentum and a potential downward move.
Exit Signals
The indicator also helps determine when to exit trades:
- Blue dot appears → Close short positions
- Red dot appears → Close long positions
Occasionally, dots may appear before a short-term price reversal. While this may signal a temporary change, the broader trend often remains intact.
What Makes It an Ideal Trend Indicator?
The Perfect Trendline Indicator stands out due to its:
- Simple and intuitive design
- Clear visual signals (dots and colored candles)
- Reliable Trend Confirmation using dual trendlines
It is especially useful for forex traders looking for a straightforward trend-following system without complex setups.
Conclusion
The Perfect Trendline Indicator for MT5 delivers a clean and effective way to identify market trends using trendlines and dot signals. It simplifies trading decisions by clearly marking buy and sell opportunities, along with entry and exit points.
Best of all, the indicator is free to download, making it accessible to both beginner and experienced forex traders seeking a reliable trading tool.
28 Downloads
Published:
Apr 14, 2026 12:45 PM
Category: