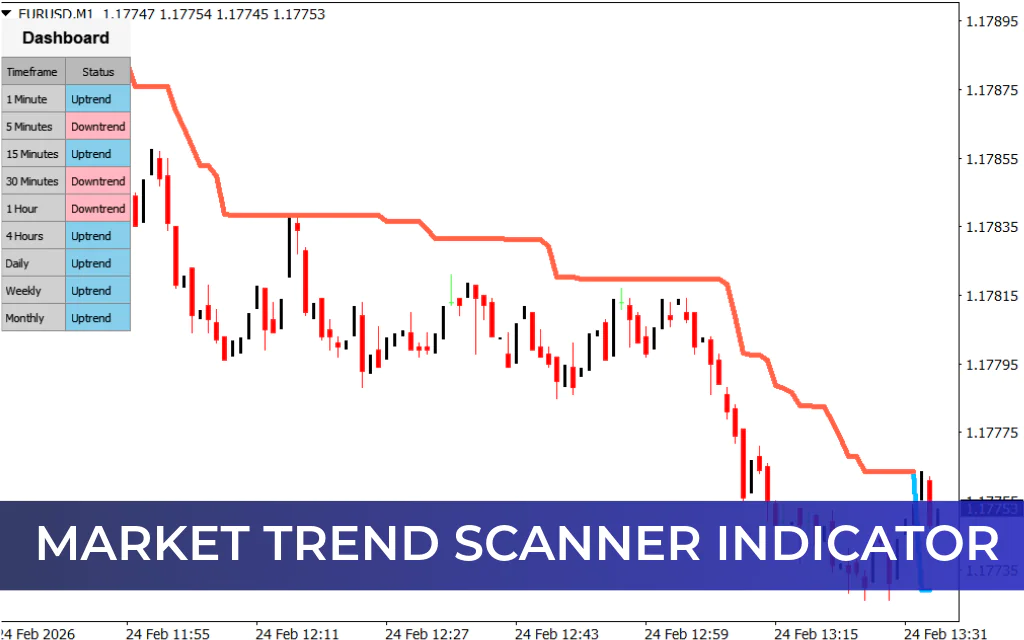
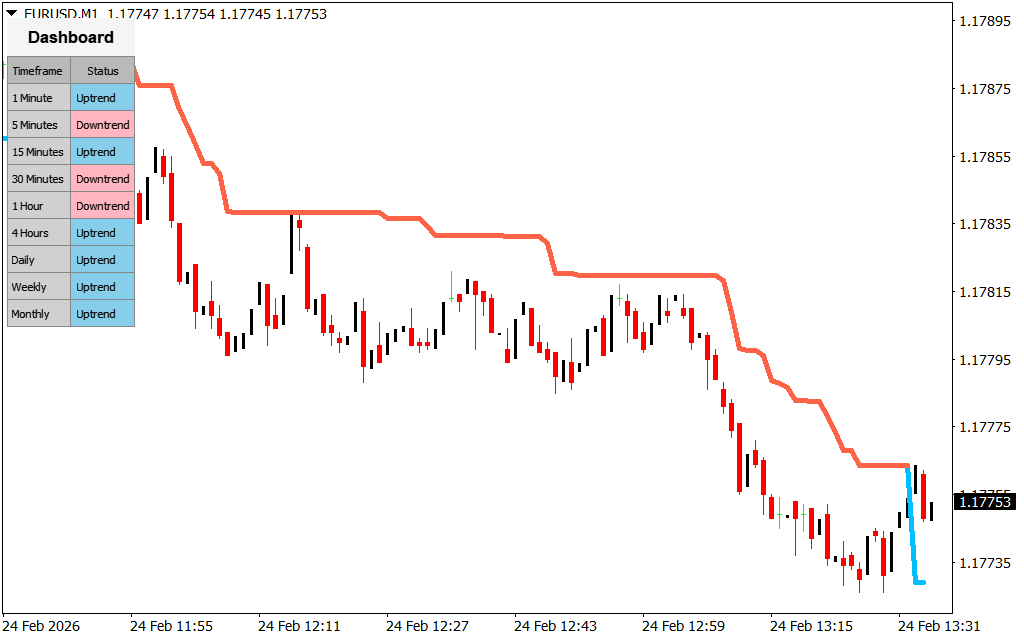
The Market Trend Scanner Indicator is a sophisticated yet user-friendly tool designed for traders who rely on multi-timeframe analysis. By providing a clear visual overview of trend directions across various timeframes, this indicator simplifies complex market data and helps identify the best trading opportunities. Whether you are a scalper, day trader, or swing trader, it delivers precise insights to improve trading accuracy.
Key Features of the Market Trend Scanner Indicator
- Multi-Timeframe Trend Analysis: Monitor trends across multiple timeframes simultaneously for a comprehensive view of market momentum.
- Visual Dashboard: Blue bars indicate uptrends, red bars signal downtrends, making trends easy to interpret at a glance.
- Early Reversal Signals: Detect divergences between timeframes to anticipate potential market shifts and adjust your strategy accordingly.
- Customizable Settings: Tailor the indicator to fit your trading style, timeframe preferences, and strategy requirements.
- Actionable Insights: Quickly identify aligned trends for strong trading opportunities and better risk management.
Why Traders Use Market Trend Scanner Indicator
The Market Trend Scanner Indicator streamlines multi-timeframe market analysis, reducing guesswork and enhancing decision-making. Its intuitive dashboard allows traders to spot high-probability trades, manage multiple instruments efficiently, and integrate seamlessly with market trend analysis guides, technical indicator tutorials, and MT4 setups. This makes it a versatile tool for traders at all levels.
Conclusion
For traders aiming to simplify market analysis while gaining actionable insights, the Market Trend Scanner Indicator is essential. Its multi-timeframe capabilities, intuitive visual signals, and customizable features provide a clear edge in identifying trend-aligned opportunities. Download the Market Trend Scanner Indicator today to enhance your trading strategy and trade with confidence.
FAQ
4 Downloads
Published:
Feb 24, 2026 07:37 AM
Category: