The MACD on Chart Indicator for MT5 is an advanced trend-following tool that brings the power of the classic MACD directly onto your price chart. Unlike the traditional Moving Average Convergence Divergence indicator, which appears in a separate window, this version overlays signals on the main chart—making analysis faster and more intuitive.
Designed as an automatic trend scanner, the indicator continuously monitors market momentum and highlights potential trading opportunities using clear visual signals.
Why Choose MACD on Chart Indicator?
This indicator simplifies trading by removing the complexity of interpreting multiple lines and crossovers. Instead, it generates ready-to-use signals in the form of arrows directly on the chart.
Key advantages include:
- Displays signals directly on the main chart
- Eliminates the need to interpret MACD crossovers manually
- Provides clear BUY/SELL arrows for quick decisions
- Works across forex, stocks, and other trading instruments
- Suitable for multi-timeframe (MTF) analysis
Its user-friendly design makes it ideal for both beginners and experienced traders.
How the Indicator Works
The MACD on Chart Indicator uses core MACD components such as EMAs, signal lines, and momentum analysis—but processes everything internally to generate simplified outputs.
Instead of lines, it displays:
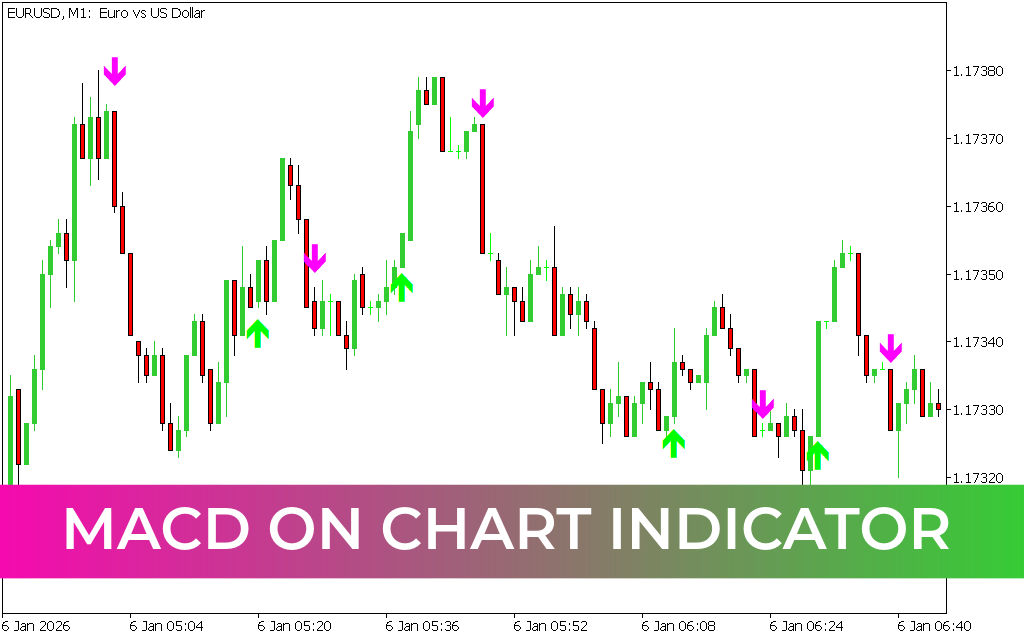
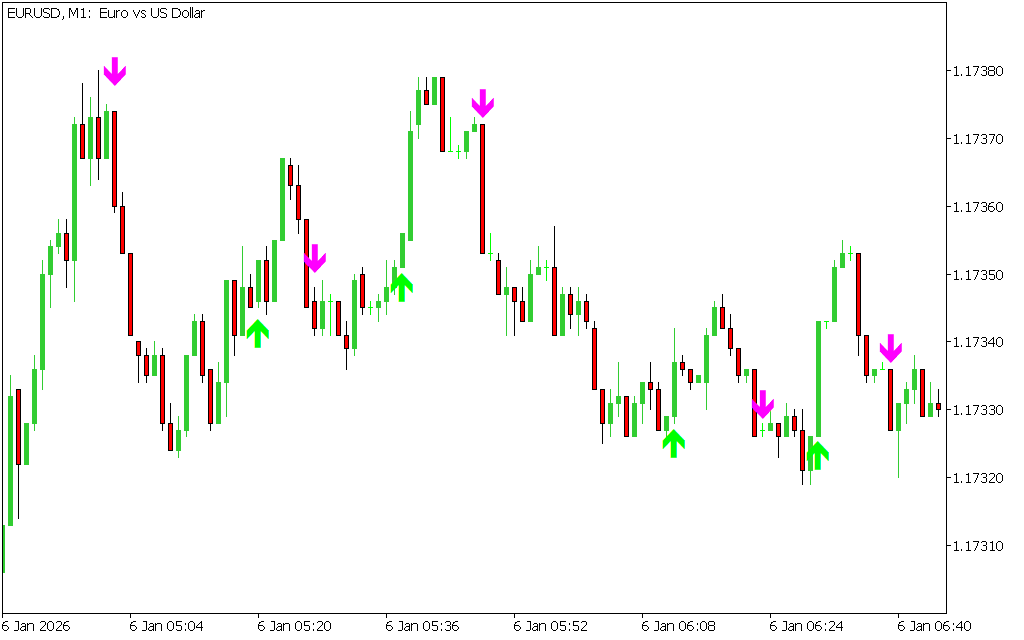
- Green Up Arrow: Indicates a potential bullish trend and BUY opportunity
- Purple Down Arrow: Signals a potential bearish trend and SELL opportunity
These arrows appear directly on the price chart, allowing traders to react quickly to changing market conditions.
Trading Strategy Using MACD on Chart
To trade effectively with this indicator, follow these simple guidelines:
Buy Setup
- Wait for a green upward arrow to appear
- Confirm with price movement or Price Action
- Enter a BUY (long) position after confirmation
- Exit: When a new downward arrow appears or momentum weakens
Sell Setup
- Look for a purple downward arrow
- Confirm that price begins to move downward
- Enter a SELL (short) position
- Exit: When a green arrow appears or trend reverses
Example in Action
On an EUR/USD chart, the indicator clearly highlights trend shifts:
- After a green arrow appears, price often moves upward with minor pullbacks—ideal for long trades
- When a purple arrow forms, it signals downward momentum—creating short opportunities
This visual approach makes it easy to follow trends without overcomplicating analysis.
Best Practices for Better Results
Although the indicator is highly effective, combining it with other tools can improve accuracy:
- Use price action for confirmation
- Apply support and resistance levels
- Avoid trading immediately on signal without validation
- Use proper risk management strategies
Final Thoughts
The MACD on Chart Indicator for MT5 offers a modern and simplified approach to momentum trading. By transforming complex MACD calculations into clear visual signals, it helps traders identify high-probability opportunities with ease.
Whether you're trading forex, stocks, or other assets, this indicator can significantly enhance your ability to spot trends and act quickly in dynamic markets.
27 Downloads
Published:
Apr 13, 2026 11:27 AM
Category: