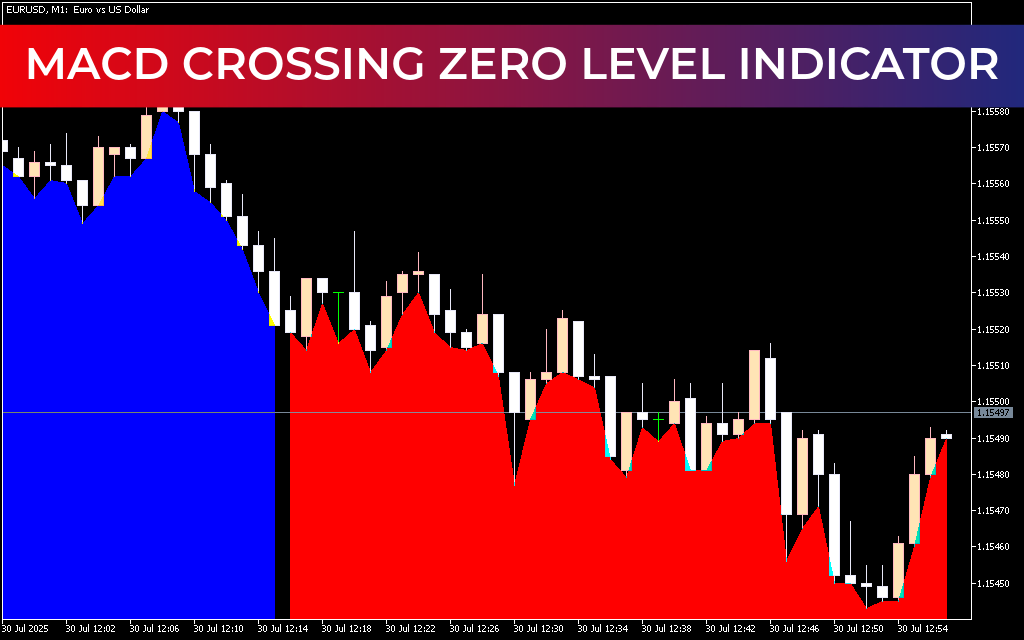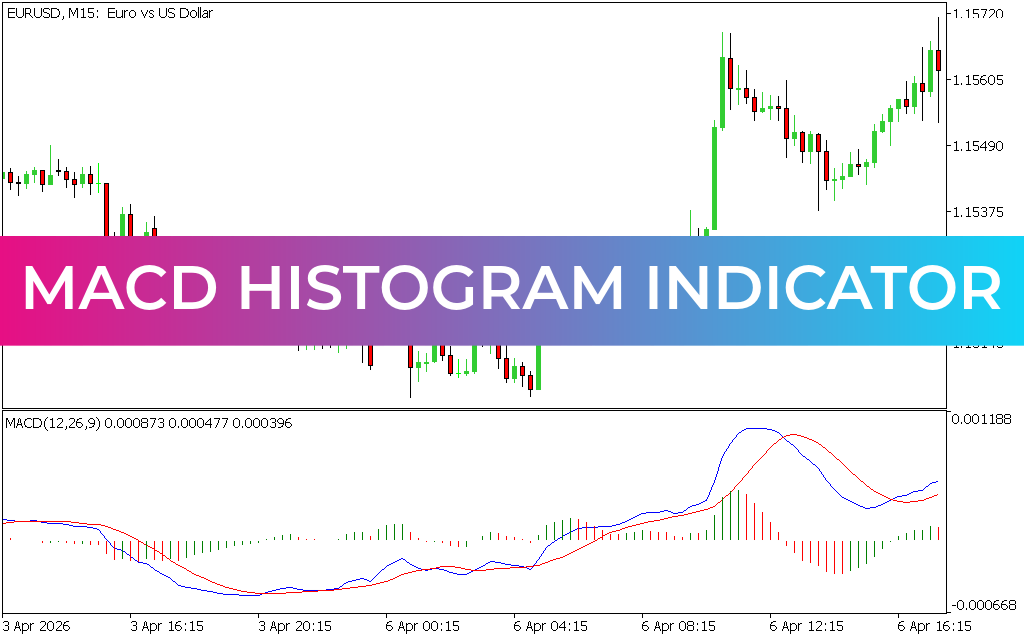
The MACD Histogram Indicator for MT5 is a powerful tool that combines moving average crossovers with a color-coded histogram. It helps traders visualize momentum shifts and identify potential buy and sell signals with clarity. Suitable for both beginners and experienced Forex traders, this indicator works seamlessly across all timeframes — from intraday charts to long-term daily, weekly, and monthly analyses.
How the MACD Histogram Works
The indicator plots two moving averages:
- A faster moving average
- A slower moving average
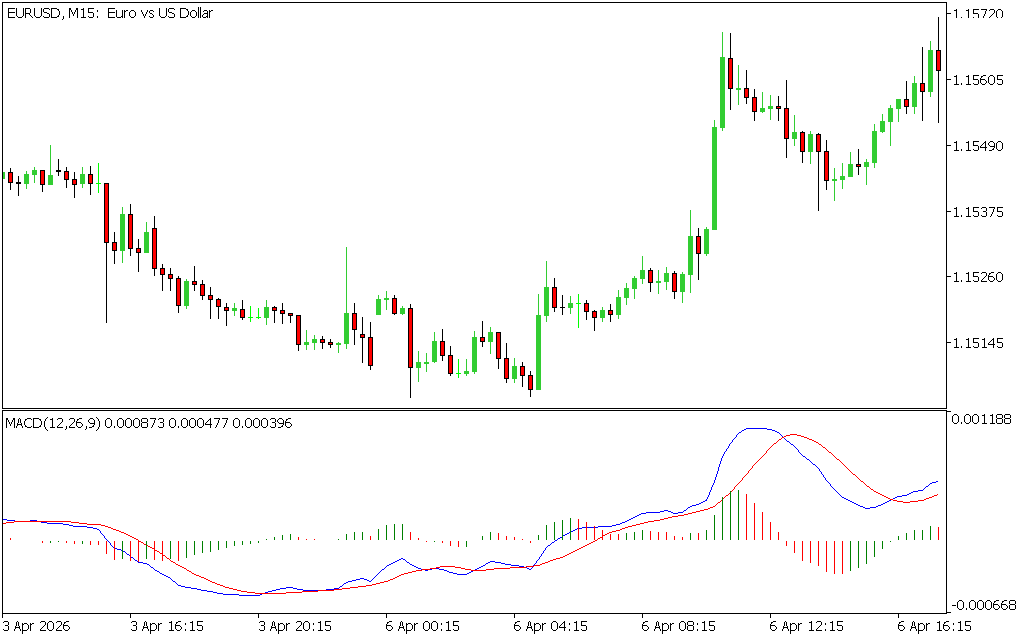
The histogram represents the difference between these averages, changing color to reflect market sentiment:
- Green bars indicate bullish momentum.
- Red bars signal bearish momentum.
This simple visual representation makes it easy to spot trend changes and trading opportunities.
Trading Signals with the MACD Histogram
- Buy Signal: When histogram bars turn green, traders can enter long positions with a stop loss below the previous swing low.
- Sell Signal: When bars turn red, traders can enter short positions with a stop loss above the previous swing high.
- Exit Strategy: The indicator does not provide profit targets. Traders should follow the trend and exit when an opposite signal appears.
Why Traders Use the MACD Histogram
- Versatility: Works for scalpers, short-term, and long-term traders.
- Clarity: Easy to interpret, even for beginners.
- Confirmation Tool: Often used alongside other technical indicators for stronger signals.
- Automation: Widely integrated into automated trading systems for trend identification.
Conclusion
The MACD Histogram Indicator for MT5 is an excellent tool for identifying momentum shifts and trend reversals. Its simplicity, versatility, and effectiveness make it a must-have for Forex traders seeking reliable trading signals.
1 Download
Published:
Apr 07, 2026 05:19 AM
Category: