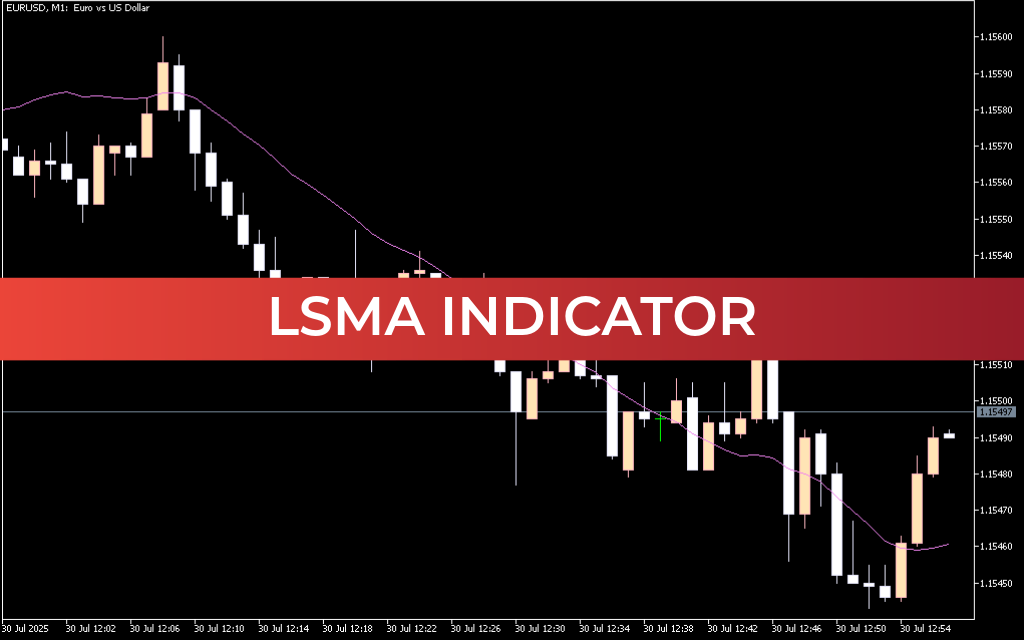
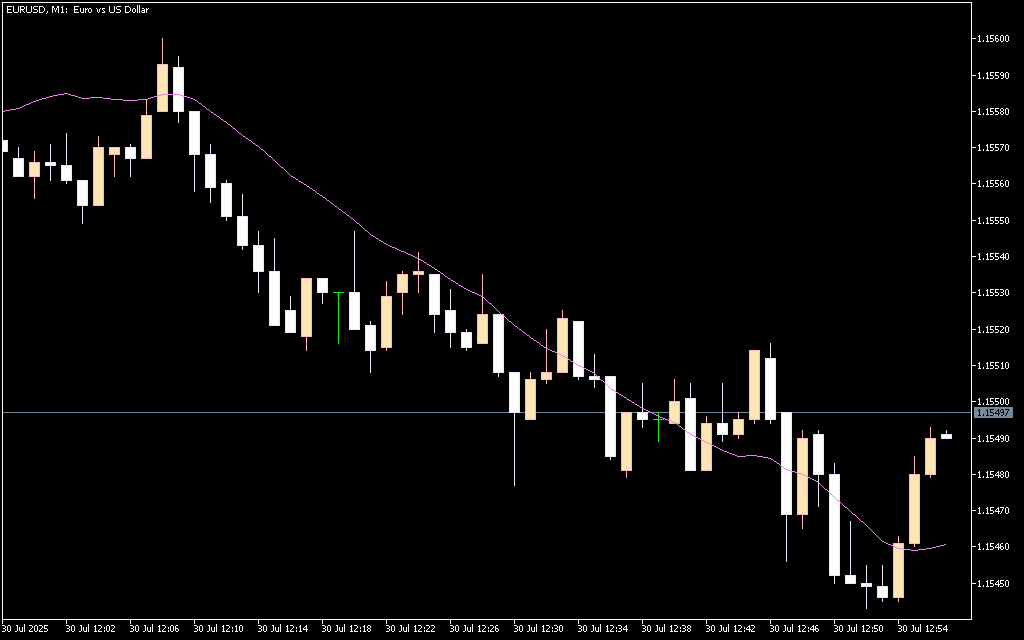
The LSMA (Least Squares Moving Average) Indicator for MetaTrader 5 is a trend-following tool that uses linear regression analysis to identify bullish and bearish Forex trends. Unlike traditional moving averages, the LSMA calculates the least squares regression line, allowing it to project a smoother and more responsive trend line based on current price data.
In simple terms, the LSMA uses existing price levels to estimate the most probable future direction of the indicator line. This predictive characteristic makes it a powerful tool for identifying early trend changes.
The indicator is suitable for both beginner and advanced traders and works effectively on all timeframes, including intraday charts (M1–H4) as well as daily, weekly, and monthly charts.
How the LSMA Indicator Works
- The indicator plots a single dynamic line directly on the price chart.
- When the line slopes upward → Bullish trend
- When the line slopes downward → Bearish trend
- When the line is flat or horizontal → Sideways / weak market conditions
Because LSMA reacts to price changes using regression calculations, it can respond faster than many traditional moving averages.
LSMA Trading Signals
📈 Buy Signal
- Occurs when the LSMA line changes direction upward.
- Indicates potential start of a bullish trend.
- Traders can open a long position.
- Place stop loss below the previous swing low.
- Exit when:
- An opposite signal appears, or
- The line begins to flatten or reverse.
📉 Sell Signal
- Occurs when the LSMA line turns downward.
- Signals potential bearish momentum.
- Traders can enter a short position.
- Place stop loss above the previous swing high.
- Exit when:
- Opposite signal appears, or
- The line begins to level off.
Important Trading Note
When the LSMA line is nearly horizontal, it indicates low momentum or a ranging market. In such conditions, it is generally wise to remain on the sidelines and wait for a clear directional slope.
Advanced traders should remember that LSMA is fully based on price changes, so market volatility can influence its responsiveness.
Key Benefits
- Faster reaction compared to traditional moving averages
- Clear visual trend identification
- Works on all timeframes
- Suitable for Scalping, day trading, and swing trading
- Helps detect early trend reversals
Conclusion
The LSMA Indicator for MT5 is a powerful trend-following tool that uses linear regression to identify and predict market direction. By monitoring changes in the slope of the indicator line, traders can detect bullish and bearish opportunities with improved accuracy. It is especially effective when combined with other confirmation tools for stronger trade setups.
FAQ
Published:
Mar 04, 2026 16:22 PM
Category: